
TL;DR:
- Larger sample sizes do not guarantee accuracy; sample quality and representativeness are crucial.
- Biases like coverage bias and nonresponse bias can distort results regardless of sample size.
- Active validation and adaptive sampling strategies improve research reliability and decision-making.
You might assume that a bigger sample always produces better research. It feels logical. More data, more accuracy, right? Not quite. The 1936 Literary Digest poll collected 2.4 million responses and still predicted the wrong winner of the U.S. presidential election. Meanwhile, George Gallup’s much smaller, more carefully selected sample got it right. That single historical moment changed how researchers think about data forever. Size isn’t everything. Quality matters. And if you’re making decisions based on flawed samples, you’re building strategy on sand.
Table of Contents
- How sampling flaws can mislead, even with massive data
- Understanding sample bias: Coverage, nonresponse, and edge cases
- Sample size vs. sample quality: What matters most?
- How to validate and strengthen your sample selection
- Our perspective: What most research frameworks miss about sample selection
- Ready to elevate your research? Get expert sampling support
- Frequently asked questions
Key Takeaways
| Point | Details |
|---|---|
| Sample quality over size | A small, well-selected sample produces more accurate results than a large but biased one. |
| Bias can distort findings | Coverage and nonresponse bias can invalidate research, even with advanced analytics. |
| Always validate your sample | Regularly compare your sample to the target population and adjust as needed. |
| Practical techniques make the difference | Quotas, stratification, and iterative validation help ensure representative and actionable research results. |
How sampling flaws can mislead, even with massive data
Let’s look closer at how even massive datasets can lead you astray if your sample isn’t representative.
The Literary Digest disaster is one of the most cited examples in research methodology, and for good reason. The magazine mailed out surveys to people listed in telephone directories and automobile registration records. On the surface, that sounds like a wide reach. In practice, it was a deeply flawed sampling frame. In 1936, owning a phone or a car was a marker of wealth. Working-class Americans, the majority of voters, were almost entirely excluded. The result? A biased sampling frame that gave the magazine a confident but completely wrong prediction.
Here’s what makes this story so relevant today. Gallup didn’t have anywhere near 2.4 million respondents. He used a quota sampling method, carefully selecting respondents who mirrored the broader voting population. His sample was smaller, smarter, and more accurate. The lesson? More data collected from the wrong people is still wrong data.
Modern market research falls into eerily similar traps. Opt-in online surveys are a common culprit. When you rely exclusively on people who choose to participate, you systematically exclude those who don’t engage with digital platforms or don’t feel motivated to respond. That leaves you with a skewed picture of your target audience.
There are two key types of bias you need to watch for:
- Coverage bias: Your sampling frame excludes certain groups entirely, meaning they have no chance of being selected.
- Nonresponse bias: People are invited to participate, but certain groups consistently decline, leaving a gap in your data.
“Large biased samples are worse than small representative ones. The Literary Digest poll is the textbook example, but the same dynamics play out constantly in modern opt-in online polls.”
Understanding polling accuracy and analytics is essential for any researcher who wants to avoid these traps. The mechanics of bias haven’t changed. What has changed is the speed at which flawed data can influence decisions. Avoid these market research pitfalls by building your sampling strategy around representativeness from day one, not as an afterthought.
| Source | Sample size | Method | Outcome |
|---|---|---|---|
| Literary Digest (1936) | 2.4 million | Biased mail survey | Wrong prediction |
| Gallup (1936) | ~50,000 | Quota sampling | Correct prediction |
| Typical opt-in online survey | Varies | Self-selected | Potential bias risk |
| Probability-based survey | Smaller | Random selection | Higher reliability |
The table above tells a clear story. Bigger numbers did not save the Literary Digest. Method did.
Understanding sample bias: Coverage, nonresponse, and edge cases
To prevent repeating historical errors, you need to know exactly how bias creeps into samples and how to spot it before it damages your findings.
Coverage bias is the first threat. It occurs when your sampling frame, the list or method you use to identify potential respondents, leaves out entire segments of the population you care about. Think about a brand that surveys customers through its mobile app. If older demographics or lower-income customers rarely use the app, they’re invisible to that research. The data might show glowing satisfaction scores, but they only reflect a segment of the actual customer base.
Nonresponse bias is sneakier. You might have a technically sound sampling frame, but if certain groups are far less likely to respond, your final sample still skews. Edge cases like nonresponse don’t just create minor inaccuracies. They amplify your initial biases and can flip conclusions entirely.
Here’s a practical breakdown of how to spot bias early:
- Define your target population clearly. Who exactly are you trying to learn from? Demographics, geography, behaviors, all of it.
- Audit your sampling frame. Does your list or platform actually include all relevant subgroups? Where does it fall short?
- Track response rates by segment. If one demographic responds at 40% and another at 8%, you have a nonresponse problem worth addressing.
- Cross-check sample demographics. Before analysis, compare your respondents’ age, income, location, and other key traits against your target population.
- Flag outlier response patterns. Unusual spikes in one subgroup could indicate a systematic issue in how invitations were distributed.
Pro Tip: Always request benchmark data on your target population before fieldwork begins. Knowing what your ideal sample should look like makes it far easier to spot when your actual sample drifts off course.
A statistic worth knowing: Research consistently shows that response rates for unsolicited surveys have declined sharply over the past two decades, in some contexts dropping below 10%. That kind of nonresponse opens the door wide to bias unless corrective action is taken.
Applying effective sampling methods from the start is far more efficient than trying to correct for bias after you’ve collected data. And if your project involves varied audience sizes or scopes, scalable research approaches can help you maintain rigor without ballooning costs.
Sample size vs. sample quality: What matters most?
Bias isn’t the only concern. Let’s separate myth from reality about the power of large samples.
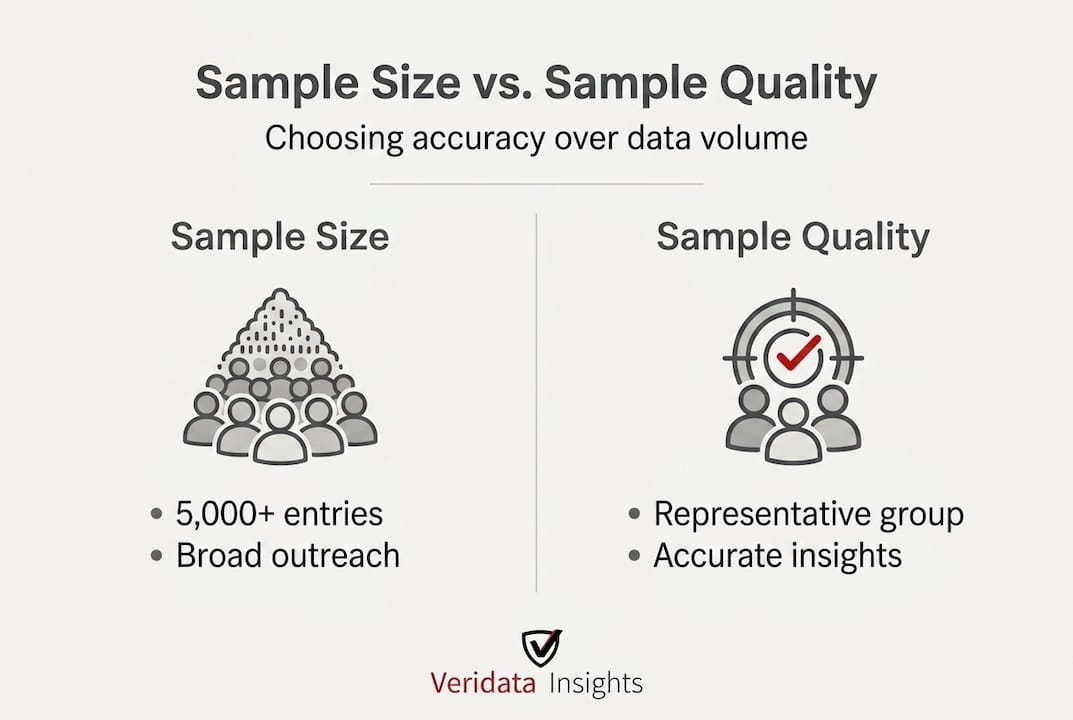
Here’s a belief that lives on in boardrooms, briefs, and budget conversations: a bigger sample is automatically a better sample. It feels intuitive. But large biased samples consistently underperform smaller, well-structured ones. That’s not a controversial claim. It’s documented history, and it’s being replicated today in how organizations misread opt-in survey data.
More data is only better if it reflects your population accurately. A 5,000-person sample drawn from a representative frame will almost always outperform a 50,000-person sample drawn from a skewed one.

Consider client satisfaction surveys. Many companies blast out post-purchase surveys to every customer. Sounds thorough. But customers who had a very strong reaction, either delighted or furious, are far more likely to respond. The result is a bimodal distribution that overrepresents the extremes and underrepresents the silent majority. The data looks robust. The conclusions are distorted.
Comparison: Sample size vs. sample quality
| Scenario | Sample size | Sample quality | Reliability |
|---|---|---|---|
| Biased frame, high volume | Very large | Poor | Low |
| Representative, probability-based | Moderate | High | High |
| Opt-in digital survey | Large | Variable | Inconsistent |
| Stratified quota sample | Small to medium | High | High |
Use this checklist when assessing sample quality before you start or sign off on a research design:
- Does the sampling frame include all relevant subgroups of the target population?
- Are quotas or stratification layers in place to ensure proportional representation?
- Is the recruitment method likely to introduce self-selection bias?
- Has the project accounted for expected nonresponse rates by segment?
- Is there a validation plan to compare respondent demographics with population benchmarks?
Pro Tip: Before your next research project kicks off, ask your sampling team to show you the expected profile of respondents versus the actual target population. If those two profiles aren’t close, push back before fieldwork begins, not after.
Overcoming market research bias is not a one-time checklist. It’s a discipline built into how you design, execute, and evaluate every study. Understanding the market research process end to end helps you anticipate where quality can slip and where it can be strengthened.
How to validate and strengthen your sample selection
Armed with an understanding of the hazards, here’s how you can put theory into practice and ensure valid, actionable results.
Validation is not a final step. It’s a running process throughout your research project. Waiting until data collection is complete to check sample quality means you’ve already locked in whatever bias exists. The goal is to build checkpoints into the process so you can course-correct in real time.
Here’s a step-by-step approach:
- Set demographic targets before launch. Define what your final sample should look like in terms of age, gender, region, income, and any other relevant attributes.
- Monitor incoming data in real time. Check response distributions daily or even more frequently during active fieldwork. Catching a skew early gives you time to adjust.
- Apply quotas at the segment level. Hard quotas ensure that no subgroup fills faster than intended. Soft quotas let you track progress without enforcing hard stops.
- Use stratified sampling where possible. Divide your population into distinct strata and sample from each proportionally. This is especially useful when certain subgroups are small but analytically important.
- Run a mid-field comparison. Halfway through data collection, compare your current sample composition against your targets. Redirect recruiting efforts if segments are lagging.
- Apply post-weighting if necessary. If your final sample still overrepresents or underrepresents certain groups, statistical weighting can adjust results to better reflect the target population. This is a corrective tool, not a substitute for good design.
Following these steps helps ensure that edge case issues like nonresponse don’t quietly distort your results before you even realize there’s a problem.
Beyond the mechanics, validation also requires honesty about access. Hard-to-reach populations, including B2B decision-makers, healthcare professionals, and niche consumer segments, require targeted recruitment strategies that go beyond standard panel access.
Pro Tip: When working with low-incidence or hard-to-reach audiences, plan your recruitment timeline conservatively. Rushing quota completion on rare segments is one of the fastest ways to introduce convenience bias into an otherwise sound design.
The right sampling methods for project success depend heavily on your audience and objectives. A research recruitment case study can give you a useful benchmark for what rigorous recruitment looks like in practice across different industries and audience types.
Key validation tools to keep in your toolkit:
- Demographic comparison tables: Respondents vs. population benchmarks side by side.
- Response rate tracking by subgroup: Identifies nonresponse issues early.
- Quota dashboards: Visual tracking of completion rates per segment in real time.
- Post-field weighting calculations: Corrects residual imbalances with transparency.
Each of these tools is practical, actionable, and well within reach for any research team that builds them into standard workflow.
Our perspective: What most research frameworks miss about sample selection
With these tools in hand, let’s step back for a broader view grounded in years of practical, hands-on research.
Most textbooks and research frameworks treat sampling as a statistical exercise. Define the population, calculate a sample size, pick a method, done. We get it. That’s a clean, teachable model. But real-world research rarely follows a clean script.
Here’s what we’ve seen time and time again: organizations invest significant energy into designing a theoretically sound sampling plan, then face budget pressure, compressed timelines, and limited panel access once the project actually starts. Those practical constraints erode the plan fast. Quotas get fudged. Timelines get cut. Recruitment shifts toward easier-to-reach respondents rather than the right respondents. And the theoretical elegance of the original design ends up having almost no bearing on what actually got collected.
The uncomfortable truth is that the most dangerous sampling mistakes don’t happen because researchers don’t know better. They happen because the system around the research doesn’t support doing it right. That’s a structural problem, not just a knowledge problem.
What actually works, in our experience, is building iterative feedback loops into the project from the start. Not just a pre-launch plan and a post-field report. Active monitoring. Ongoing comparison. The willingness to pause, adjust the recruitment approach, and even revisit the sampling frame mid-project if the data is drifting in a direction that doesn’t reflect the target population.
We also think the field underestimates how much transparency matters. Showing clients a quota dashboard, sharing mid-field demographic comparisons, and flagging potential issues before they become irreversible. That kind of openness builds trust and produces better decisions. Sampling methods that deliver impact aren’t just methodologically sound. They’re built on communication, flexibility, and a commitment to getting it right even when conditions aren’t ideal.
Rigid adherence to a plan designed six weeks ago is not rigor. Flexibility grounded in ongoing validation is.
Ready to elevate your research? Get expert sampling support
If you’re committed to getting your next research project right, expert support is just a click away.
At Veridata Insights, we know that the quality of your research starts with the quality of your sample. We work with clients across B2B, B2C, healthcare, and hard-to-reach audiences to design and execute sampling strategies that actually reflect the populations they’re studying. No project minimums. Full service from consultation and questionnaire design through data collection, processing, and reporting. Seven days a week, 365 days a year. Whether you need us for one piece of the process or the whole thing, we’re here. If you’re ready to stop guessing and start trusting your data, reach out to our team and let’s talk about what your next project needs to succeed.
Frequently asked questions
Why does representativeness in sampling matter more than sheer size?
Representativeness ensures your sample reflects the entire population you’re studying, which is what makes findings trustworthy. As historical cases confirm, a large biased sample reliably produces worse results than a smaller but proportionally accurate one.
What is coverage bias and how can I spot it?
Coverage bias occurs when certain population groups are excluded from your sampling frame entirely, giving them no chance of being selected. Compare your sample’s demographic profile against known population benchmarks, and flag any groups that appear underrepresented or completely absent, especially given that amplified nonresponse can make coverage gaps worse.
How can nonresponse bias affect research outcomes?
Nonresponse bias distorts findings when those who don’t participate differ in meaningful ways from those who do, such as by attitude, behavior, or demographic. Nonresponse edge cases are particularly dangerous because they compound existing biases rather than introducing isolated ones.
Is it ever safe to rely on opt-in online survey results?
Opt-in surveys carry inherent selection risk because participants self-select, which means the final sample may not reflect your broader target population. Modern parallels to opt-in bias show these issues are well documented, so always validate your findings and supplement with probability-based methods when decision stakes are high.


