
TL;DR:
- Data visualization in polling transforms raw survey results into charts and maps that reveal patterns, trends, and outliers instantly. It enhances decision-making by surfacing hidden insights, detecting data issues, and communicating findings clearly across research stages. Using appropriate chart types, advanced techniques, and best practices improves accuracy, stakeholder understanding, and the overall quality of polling analysis.
Polling data in raw numeric form is a wall of numbers that most stakeholders will not read twice. What is data visualization in polling? Simply put, it is the practice of translating poll results into charts, maps, and graphics so that patterns, trends, and outliers become immediately visible. For market researchers and data analysts, this is not a cosmetic upgrade. It is the difference between a report that drives decisions and one that collects digital dust. This guide walks you through the concepts, chart types, advanced techniques, tools, and best practices you need to get it right.
Table of Contents
- Understanding data visualization in polling
- Choosing the right charts for polling data
- Advanced visualization techniques for longitudinal and complex polling data
- Best practices for creating effective polling visualizations
- Tools and technology for interactive polling visualization
- Rethinking polling visualization: beyond the charts
- Enhance your polling visualizations with professional guidance
- Frequently asked questions
Key Takeaways
| Point | Details |
|---|---|
| Purpose of visualization | Data visualization helps quickly reveal patterns and outliers in polling, enabling faster decisions. |
| Match chart to data | Choose chart types based on question format to ensure clarity and avoid misleading visuals. |
| Use advanced charts | Apply alluvial diagrams and heatmaps for complex or longitudinal polling data. |
| Account for uncertainty | Include sample sizes and uncertainty indicators to prevent misinterpretation of visuals. |
| Leverage right tools | Modern interactive tools make real-time polling visualization more effective and user-friendly. |
Understanding data visualization in polling
Visualization converts complex survey results into formats the human brain processes far faster than tables of percentages. A bar chart showing candidate approval ratings communicates in two seconds what a spreadsheet row communicates in two minutes — if at all.
In polling specifically, visualization serves multiple roles across the research lifecycle. Visualization spans exploration to final results, helping analysts find patterns early and communicate validated findings at the end. During data exploration, a quick scatter plot might reveal that younger respondents cluster around one answer while older respondents scatter widely. That is a finding you would likely miss scanning a cross-tabulation. During final reporting, a well-built chart communicates that same finding to a boardroom in one glance.
Visualization also surfaces what raw data actively hides:
- Outliers: A single respondent segment behaving dramatically differently from the rest
- Non-linear trends: Patterns that do not follow a straight line and therefore disappear inside averages
- Interaction effects: How two variables (age and income, for example) jointly influence a response
- Data quality issues: Suspicious spikes or gaps that suggest collection problems worth investigating
Improving polling accuracy and insights starts at the visualization stage, not the reporting stage. The sooner you see the data visually, the sooner you catch problems and opportunities.
Choosing the right charts for polling data
Different poll question types demand different visuals. Using the wrong chart is not just an aesthetic error. It actively misleads your audience. Match the chart to the question type: bar charts for categorical data, line charts for trends, heatmaps for matrix questions.

Here is a quick reference to match chart types to question formats:
| Question format | Best chart type | Why it works |
|---|---|---|
| Single-choice categorical | Bar chart | Easy comparison across discrete options |
| Multiple-choice | Grouped bar or dot plot | Shows co-selection patterns clearly |
| Likert scale (agree/disagree) | Diverging stacked bar | Centers neutral responses, shows polarity |
| Matrix question | Heatmap | Handles density across rows and columns |
| Trend over time (repeated polls) | Line chart | Shows movement and momentum clearly |
| Geographic distribution | Choropleth map | Spatial patterns become obvious |
A few principles that separate clean polling visualizations from confusing ones:
- Always sort bar charts by frequency unless the order itself carries meaning (like chronological time)
- Use diverging bars for Likert scales rather than stacked bars with a “neutral” block in the center, which compresses the story
- Limit pie charts to two or three categories maximum. Beyond that, humans cannot reliably read slice differences
- Annotate directly on the chart where possible rather than forcing readers to match legends to colors
Good survey design tips feed directly into better visualizations. If your question is designed cleanly, the chart will be too. Ambiguous question wording produces ambiguous data that no chart can rescue.
Pro Tip: Before building any visualization, write one sentence describing what a non-analyst stakeholder should understand from it. If you cannot write that sentence clearly, your chart is not ready yet.
Advanced visualization techniques for longitudinal and complex polling data
Beyond basic charts, experienced analysts use specialized visuals to capture complex polling insights over time and across multiple dimensions. These are not fancy for the sake of it. They solve specific problems that standard charts cannot.
Alluvial diagrams show attitude changes over time in panel surveys, while rose plots and beeswarm charts visualize directionality and distribution density. Here is what each technique does and when to reach for it:
- Alluvial (Sankey-style) diagrams: Track how individual respondents shift between answer categories across two or more time points. Perfect for panel polls where you resurvey the same people. A respondent who said “strongly approve” in Q1 and “somewhat disapprove” in Q3 shows up as a visible flow, not a buried percentage change.
- Rose plots (polar area charts): Excellent for polling data with a directional or cyclical element, such as sentiment tracked across months of the year or across geographic compass directions in spatial research.
- Beeswarm plots: Each data point is a dot, but instead of overlapping, they are arranged to show distribution density. Far more honest than a box plot when your polling sample is small or skewed.
- Heatmaps for Likert matrices: When you have a 10-item attitude battery scored 1 to 5, a heatmap with color intensity across items and respondent segments reveals clusters at a glance.
The challenge with advanced techniques is audience calibration. Your internal analytics team will love an alluvial diagram. Your client’s marketing director may not. Know your end audience before choosing your visual approach.
Pro Tip: Always include a simplified version of complex visuals alongside the advanced chart in stakeholder reports. One for the analyst, one for the decision-maker. Both need to walk away with the same conclusion.
Strong polling data analysis methodology is what gives these advanced visuals credibility. The chart is only as trustworthy as the data going into it.
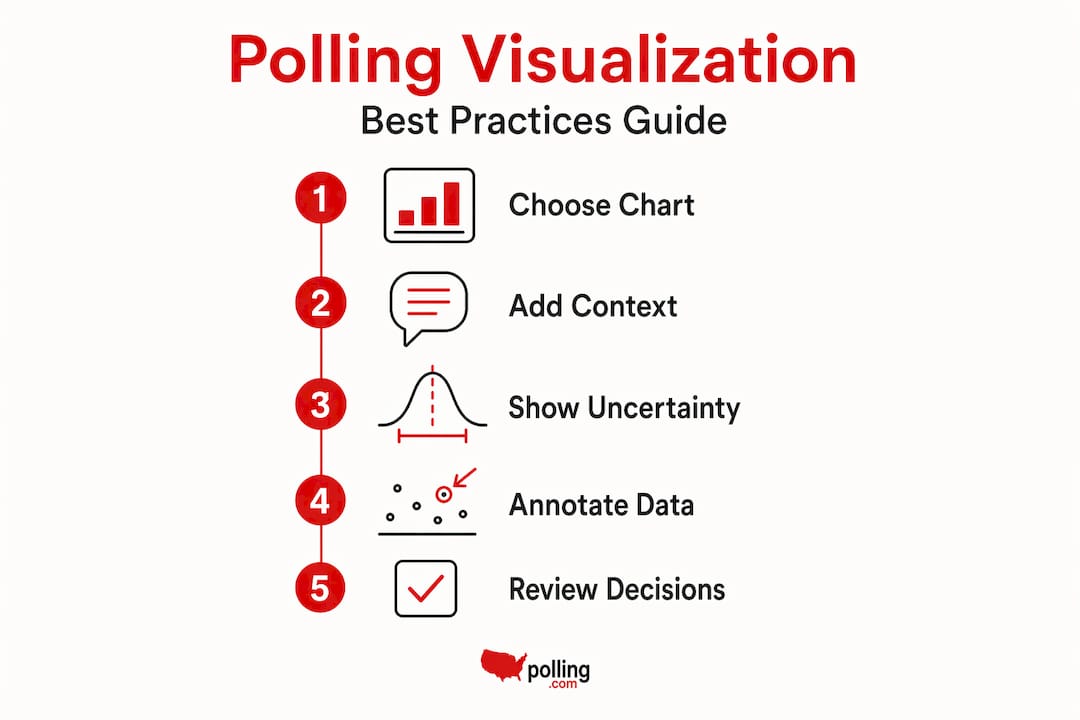
Best practices for creating effective polling visualizations
With advanced techniques covered, let’s focus on how to build trustworthy polling visuals that your teams can actually rely on.
- Weight before you visualize. Always apply sampling weights to your data before generating any chart. A visualization built on unweighted polling data misrepresents the population you surveyed, full stop.
- Show your uncertainty. Include confidence intervals, margin of error bands, or at minimum a sample size callout. Visual uncertainty cues prevent stakeholders from reading differences as meaningful when they are statistically within the noise.
- Avoid truncated axes. Starting a bar chart y-axis at 42% instead of 0% makes a three-point difference look like a chasm. This is one of the most common and most misleading errors in polling visuals.
- Label directly on the chart. Legends create work. Placing the category label directly on or next to the data element reduces cognitive load and speeds comprehension.
- Use color purposefully. Color should carry meaning: warmer tones for higher values, diverging palettes for agree/disagree scales. Never use color just for decoration, and always check accessibility for color-blind readers.
- Iterate with stakeholders. Share drafts. Ask what question the chart answers for them. You will catch misreadings before the final report goes out.
Pro Tip: Run your polling visualization past someone who was not involved in the data collection. If they draw the wrong conclusion, the chart needs revision, not the audience.
“Visuals should be paired with clear notation of weighting approaches and margin of error so that stakeholders are not inferring statistical significance from visual patterns alone.”
Anchor your polling visualization best practices in the same rigor you apply to your methodology. The visual layer is not decoration on top of analysis. It is analysis.
Tools and technology for interactive polling visualization
After mastering what to visualize and how, selecting the right tools completes the visualization workflow for polling.
General business intelligence platforms are powerful but come with tradeoffs for polling-specific work:
- Tableau: Excellent for exploratory analysis and dashboarding, with strong chart variety. Less suited to live poll data ingestion without custom pipeline work.
- Power BI: Solid for organizations already in the Microsoft ecosystem. Good for static reporting; real-time polling updates require additional configuration.
- R and Python (ggplot2, Plotly, Seaborn): Ideal for analysts who want full control over visual output, statistical integration, and reproducibility. Steeper learning curve, highest flexibility.
- Zigpoll: Purpose-built for polling contexts, Zigpoll offers real-time visualizations with features tailored to live survey data capture and participant engagement tracking.
The right tool depends on your workflow. If you are running repeated cross-sectional polls and reporting to non-technical stakeholders, a BI platform with templated dashboards works well. If you are managing live polls with real-time decision requirements, specialized tools built for that environment will save you significant rework.
APIs matter here too. Tools that connect directly to your data collection platform via API eliminate manual export steps and reduce the lag between data collection and visualization. In fast-moving polling environments, that lag is the enemy of good decisions.
Explore your polling data tools options with your specific workflow in mind. The fanciest tool is always the one your team will actually use consistently.
Rethinking polling visualization: beyond the charts
Here is an uncomfortable truth most visualization guides skip: you can build a technically correct chart and still mislead every person who looks at it. Not through dishonesty. Through omission.
Stakeholders frequently misread visual differences as statistically significant without understanding that some of those differences fall well within the margin of error. A two-point shift in candidate favorability looks dramatic on a line chart. If your sample is 400 respondents and your margin of error is plus or minus four points, that shift is noise. But the chart does not say that unless you build it in.
This is why we believe effective polling visualization insights come from treating visualization as a communication discipline. Not just a technical one. The chart is only half of the job. Educating your audience on what the chart can and cannot tell them is the other half.
In practice, this means building briefs alongside dashboards. It means annotating charts with context, not just numbers. It means being willing to say in a presentation, “this difference is not large enough to act on.” That takes confidence. It also builds the kind of stakeholder trust that makes your next report land with more credibility.
We have seen organizations invest heavily in beautiful dashboards and then watch leadership make decisions based on visual patterns that had no statistical backing. The visual was accurate. The interpretation was not. The fix is not simpler charts. It is smarter context around them.
Enhance your polling visualizations with professional guidance
Knowing the theory is one thing. Applying it inside a real organization with tight timelines, mixed-skill stakeholders, and complex survey designs is another situation entirely. That is where we come in.
At Veridata Insights, we handle the full polling visualization workflow, from questionnaire design and weighting to reporting, analytics, and chart production. We work with B2B, B2C, healthcare, and hard-to-reach audiences, seven days a week, with no project minimums. Whether you need a single visualization reviewed or a complete data analysis and reporting build-out, we match our support to your scope. Connect with our team to get expert polling visualization help that turns your survey data into something stakeholders actually use.
Frequently asked questions
What exactly does data visualization in polling involve?
It involves transforming raw poll and survey data into visual formats like charts and maps that highlight trends and outliers. Polling data becomes actionable when visual formats allow stakeholders to recognize patterns quickly rather than parsing rows of numbers.
Which chart types are best for different polling question formats?
Bar charts suit categorical data, stacked or diverging bars are best for Likert scale responses, heatmaps work well for matrix questions, and line charts are ideal for trends. Match the chart to question type to preserve clarity and prevent misreading.
How can I avoid misinterpreting polling visuals?
Include sample sizes and uncertainty indicators, avoid misleading axis scales, and educate stakeholders on statistical meaning before sharing visuals. Uncertainty cues in polling visuals are the single most effective guard against overinterpretation.
Are there specialized tools for real-time polling data visualization?
Yes. While general BI platforms handle static reporting well, Zigpoll supports real-time visualization with features built specifically for live survey data capture and interactive analysis workflows.
Recommended
- How Analytics Transforms Polling Accuracy and Insight
- Data analysis step by step for market researchers in 2026 – Veridata Insights
- Custom Market Research Solutions: Turning Data Into Strategy with Veridata Insights – Veridata Insights
- How Veridata Insights Ensures Your Market Research Project Is A Success – Veridata Insights


