TL;DR:
- Manufacturing data collection starts with identifying and connecting five key data tiers across the plant. Focusing on a minimum setup with synchronized timestamps and semantic consistency ensures reliable analysis and continuous improvement. Early stakeholder engagement and phased deployment build credibility, driving data-driven decision-making throughout operations.
Manufacturing data collection step by step is the organized process of capturing, integrating, and validating diverse production data streams to enable real-time analysis and continuous improvement. Most plants currently capture less than 40% of potential data sources, which means the majority of operational insight sits locked in machines, clipboards, and disconnected systems. Industry frameworks like ISA-95 and VDI 5600 define how manufacturers should structure data flows across plant-floor and enterprise systems. Getting this right lifts key performance indicators like Overall Equipment Effectiveness (OEE) and gives operations teams the cost transparency they need to act fast.
What are the essential data types and tiers to capture?
Effective manufacturing data gathering starts with knowing what to collect. Five distinct data tiers form the foundation of any capable analytics architecture: Plant Floor/PLC, MES/Shop Floor Execution, Quality/Inspection, Asset/CMMS, and Business/ERP. Each tier feeds a different layer of analysis, from real-time cycle time monitoring to long-range cost reporting.
Timestamps are not optional. Every record across every tier must carry a synchronized timestamp, or cross-system analysis becomes guesswork. Semantic harmonization, meaning consistent units, product codes, and asset identifiers, is equally non-negotiable. Without it, a “part count” from the PLC and a “unit produced” from the MES may never reconcile.
The table below maps each tier to its primary data sources and collection methods.
| Data tier | Example sources | Collection method |
|---|---|---|
| Plant Floor / PLC | Sensors, PLCs, SCADA | OPC UA, Modbus, direct API |
| MES / Shop Floor | Work orders, operator logs | MES API, manual entry |
| Quality / Inspection | CMM, vision systems, test rigs | Direct integration, CSV import |
| Asset / CMMS | Maintenance records, work orders | CMMS API, manual upload |
| Business / ERP | Inventory, cost, throughput | ERP API, batch export |
A minimum viable data setup focuses on PLC production counts and cycle times, MES or manual quality data, and ERP throughput tracking. Starting here stabilizes data quality before you layer in complex sensor streams. Trying to connect every system on day one is the fastest way to create a data swamp instead of a data asset.
Pro Tip: Map your data sources on a whiteboard before touching a single cable. Knowing which systems exist, who owns them, and what format they output saves weeks of rework later.
How to plan and prepare for a stepwise implementation
Clear objectives come before any technology decision. Define which KPIs you want to move, whether that is OEE, scrap rate, downtime, or throughput, and work backward to identify which data feeds those metrics. Vague goals produce vague data programs.

A phased rollout beats a big-bang deployment every time. Select one pilot machine or production line that represents a common configuration in your plant. Prove the approach there, document what worked, and then replicate. This limits risk and builds internal confidence before you scale.
Preparation steps that manufacturing teams consistently overlook:
- Assign a named data owner for each system or tier, not just a department.
- Document current data formats, update frequencies, and access credentials for every source.
- Set a realistic budget that includes edge hardware, software licensing, integration labor, and ongoing maintenance.
- Build a project timeline with explicit go/no-go gates at each deployment phase.
- Plan for data democratization from the start. Shift managers and engineers need live dashboards, not just IT teams.
- Schedule a stakeholder alignment session before kickoff to surface competing priorities early.
Cultural resistance is the most underestimated barrier in any data collection process. Frontline workers sometimes see data capture as surveillance rather than support. Framing the program around making their jobs easier, not monitoring their output, changes that dynamic quickly.
Pro Tip: Identify one “data champion” on the shop floor before launch. That person becomes your internal advocate and your earliest signal when something is not working as expected.
What are the step-by-step technical execution phases?
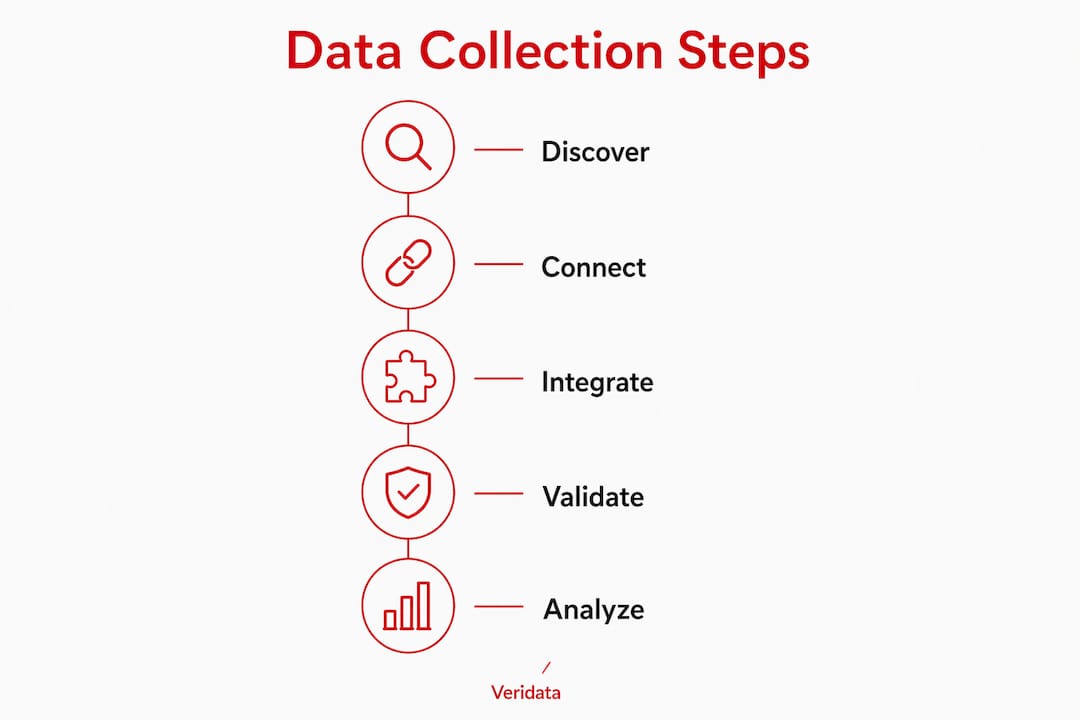
Manufacturing data collection deployments follow four sequential stages. Skipping any stage creates gaps that compound into larger failures downstream.
- Discover and map. Audit every machine, controller, and software system in scope. Document protocols (OPC UA, Modbus, MQTT), data formats, and update rates. This stage produces the connectivity blueprint for everything that follows.
- Connect and integrate. Deploy edge gateways at the plant floor level. Edge gateways handle protocol translation, store-and-forward buffering, timestamping, and ISA-95 asset tagging. They solve the three most common early failures: network downtime, data duplication, and time sync errors.
- Validate and govern. Before any dashboard goes live, run automated validation checks. Confirm that values fall within expected ranges, that timestamps are synchronized across tiers, and that no duplicate records exist. Establish data governance rules and assign ownership for each data stream.
- Scale and automate. Once the pilot line is stable, replicate the architecture to additional lines and facilities. Automate alerting for data quality failures so problems surface in minutes, not weeks.
The table below summarizes each phase with its primary output and common pitfall.
| Phase | Primary output | Common pitfall |
|---|---|---|
| Discover and map | Connectivity blueprint | Missing legacy machine protocols |
| Connect and integrate | Live data streams | Unsynchronized timestamps |
| Validate and govern | Clean, governed dataset | Skipping range checks |
| Scale and automate | Plant-wide data coverage | Replicating unresolved errors |
Real-time collection at sub-second to 5-second intervals is required for production counts, cycle times, and downtime events. Batch collection, running at minutes to daily intervals, works fine for work orders, inventory, and maintenance records. Mixing these two strategies keeps network load manageable and storage costs under control.
Pro Tip: Never timestamp data at the server. Always timestamp at the edge gateway. Server-side timestamping introduces latency errors that corrupt time-series analysis, especially when comparing events across multiple machines.
How to ensure data quality, harmonization, and scalability
Semantic harmonization is the single most common cause of manufacturing data project failures when ignored. Consistent units, product codes, and timestamps across all systems are not a nice-to-have. They are the difference between an analytics platform and an expensive data archive.
Automated validation catches problems before they reach dashboards. Build these checks into your data pipeline from day one:
- Range checks: Flag any value outside the physically possible range for that sensor or process.
- Duplicate detection: Reject or quarantine records with identical timestamps and values from the same source.
- Completeness audits: Alert when expected data streams go silent for longer than a defined threshold.
- Cross-tier reconciliation: Compare production counts from the PLC tier against MES work order completions on a shift basis.
Database schema design matters more than most teams expect. A time-series database, structured around asset hierarchy per ISA-95, performs far better than a generic relational database for high-frequency manufacturing data. OPC UA provides a standardized communication layer that simplifies future integrations as you add machines or facilities.
Scalability planning belongs in the design phase, not the expansion phase. Build redundancy into your edge layer from the start. A gateway that goes offline should not create a data gap. Store-and-forward capability at the edge ensures records buffer locally and upload when connectivity restores.
Pro Tip: Spend time early on building a shared data dictionary. Define every tag name, unit of measure, and product code in one document that all systems reference. This single artifact prevents the majority of harmonization failures.
How to connect data collection to continuous improvement
Structured automated data collection reduces reconciliation effort by 70% compared to manual tracking. That time savings does not disappear. It transfers directly into analysis, problem-solving, and process improvement work.
Dashboard adoption rises when data is trustworthy and accessible. Teams that previously spent hours reconciling spreadsheets now spend that time acting on live metrics. Democratizing access to production dashboards for shift managers and engineers accelerates process optimization and shortens reaction times to quality or throughput problems.
Linking data to manufacturing decisions through visualization is the step that converts a data collection program into a continuous improvement engine. Raw numbers sitting in a database change nothing. Numbers displayed in context, with trend lines and threshold alerts, change behavior.
Iterative improvement works best when teams review live metrics at the start of each shift, not at the end of the week. Build that rhythm into your operating model early. The data collection infrastructure you built supports it. The cultural habit is what makes it stick.
Pro Tip: Start with three KPI tiles on your first dashboard, not thirty. Overloaded dashboards get ignored. Three clear metrics that operators understand and can act on build the habit of data-driven decision-making faster than any training program.
Key takeaways
A stepwise manufacturing data collection process, built on five data tiers, semantic harmonization, and phased technical deployment, is the most reliable path to sustained operational improvement.
| Point | Details |
|---|---|
| Start with five data tiers | Capture Plant Floor, MES, Quality, Asset, and ERP data with synchronized timestamps. |
| Build a minimum viable setup first | Focus on PLC counts, MES quality data, and ERP throughput before adding complex sensors. |
| Follow four deployment phases | Discover, connect, validate, and scale in sequence to avoid compounding errors. |
| Prioritize semantic harmonization | Consistent units, codes, and timestamps prevent the most common cause of project failure. |
| Connect data to dashboards early | Automated collection cuts reconciliation effort and drives dashboard adoption across teams. |
What I’ve learned from watching data projects succeed and fail
The plants that get manufacturing data collection right share one trait: they treat it as an operations project, not an IT project. When the initiative lives in the IT department, it tends to produce technically correct data that nobody on the shop floor uses. When operations owns it, with IT as a delivery partner, the outcome is different.
The minimum viable data approach is genuinely underrated. I have watched teams spend six months trying to connect 200 data sources simultaneously, only to launch with a broken, untrustworthy dataset. The teams that start with PLC counts, one quality metric, and ERP throughput, and get those three things right, build credibility fast. Credibility is what gets the next budget approved.
The cultural side is harder than the technical side. Every time. The technology is solvable. Getting a shift supervisor to trust a dashboard more than their gut takes time, consistency, and a few wins that they can point to. Start there. Pick a metric the supervisor already cares about, show them the data matches reality, and let them draw their own conclusions.
Future-proofing means choosing open standards now. OPC UA and ISA-95 are not just best practices. They are the architecture decisions that determine whether your system can absorb new machines, new facilities, and new analytics tools five years from now without a full rebuild.
How Veridata Insights supports your data collection program
Veridata Insights works with manufacturing teams and data analysts who need a research and data partner that moves as fast as they do. Whether you need help scoping a data collection methodology, designing a data governance framework, or building the analytics layer on top of your plant-floor data, Veridata Insights brings the expertise and flexibility to match your project. There are no project minimums and no rigid service packages. The team is available seven days a week, 365 days a year. If you are ready to move from spreadsheets to a structured, scalable data program, reach out for a consultation and get started with a team that treats your data as seriously as you do.
FAQ
What is manufacturing data collection step by step?
Manufacturing data collection step by step is the structured process of identifying data sources, connecting systems across five tiers, validating data quality, and scaling the architecture to support real-time analytics and continuous improvement.
How many data tiers should a manufacturer capture?
Manufacturers should capture five data tiers: Plant Floor/PLC, MES/Shop Floor, Quality/Inspection, Asset/CMMS, and Business/ERP, with synchronized timestamps across all of them.
What is semantic harmonization in manufacturing data?
Semantic harmonization is the practice of standardizing units, product codes, asset identifiers, and timestamps across all connected systems. Without it, cross-system analysis fails and data projects stall.
What is the fastest way to start collecting manufacturing data?
Start with a minimum viable setup: PLC production counts, MES or manual quality data, and ERP throughput tracking. Stabilize those three sources before expanding to additional sensors or systems.
How does automated data collection improve dashboard adoption?
Structured automated collection reduces reconciliation effort by 70% compared to manual methods, freeing teams to act on data rather than clean it, which drives consistent dashboard use across shifts.