
TL;DR:
- Statistical methods like weighting and MRP are essential for credible polling accuracy.
- Core analytics techniques correct biases but cannot fix poor data quality or selection bias.
- AI enhances poll interpretation but requires transparency and validation to reduce risks.
When a poll misses badly, the instinct is to blame the sample. Wrong respondents, wrong demographics, wrong outreach. But that framing misses the real story. Analytics plays a central role in polling through statistical methods like weighting, post-stratification, multilevel regression with post-stratification (MRP), and predictive modeling. These techniques correct for biases that no sample design alone can fix. This guide breaks down the analytical backbone of credible polling, so you can understand what separates reliable insights from costly misses.
Table of Contents
- The evolution of analytics in polling
- Core analytics techniques: From weighting to MRP
- Addressing edge cases: Risks and limitations of analytics in polling
- AI and advanced analytics in poll interpretation
- A fresh look: What most polling analyses miss
- Put analytics to work in your organization
- Frequently asked questions
Key Takeaways
| Point | Details |
|---|---|
| Analytics now central to polling | Modern polling relies on advanced statistical methods to ensure representative and reliable results. |
| No single method fixes all bias | Combining weighting, MRP, and careful modeling works best, but depends on data quality and context. |
| AI amplifies both insight and risk | Artificial intelligence efficiently aggregates polling data but requires cautious interpretation to avoid error amplification. |
| Contextual expertise still matters | Analytics are powerful but must be paired with expert understanding of voters and survey conditions for true accuracy. |
The evolution of analytics in polling
Polling did not always look like this. Early public opinion research in the mid-20th century relied on simple random sampling and basic frequency counts. If you reached enough people, the logic went, the numbers would reflect reality. That assumption held reasonably well for a while. Then response rates collapsed, online panels exploded, and the electorate became harder to model. Simple counts stopped being enough.
The shift toward analytical rigor happened in stages. First came weighting, which adjusts raw survey results so that underrepresented groups count more and overrepresented groups count less. Then came post-stratification, which aligns weighted estimates with known population benchmarks like census data. MRP arrived as a more powerful tool, combining multilevel regression models with post-stratification to generate reliable estimates even from smaller samples.
These methods have produced real results. 2024 US polls showed an average absolute error of just 3.3 percentage points on the two-party margin, and MRP models accurately predicted outcomes in UK, Spain, and Canada elections. That is not luck. That is analytics working.
Here is a quick snapshot of how polling’s analytical toolkit has grown:
| Era | Primary method | Key limitation |
|---|---|---|
| 1940s to 1970s | Simple random sampling | Low coverage of hard-to-reach groups |
| 1980s to 2000s | Quota sampling with weighting | Prone to interviewer and selection bias |
| 2010s to present | MRP, propensity scoring, regression modeling | Model dependency and data quality risks |
Key milestones that reshaped polling analytics include:
- The 1948 Dewey-Truman polling disaster, which exposed the dangers of quota sampling
- The rise of internet panels in the 2000s, which created new non-probability sample challenges
- The adoption of MRP by academic pollsters in the 2010s, improving subnational estimates
- The 2016 US election, which forced a reckoning with turnout modeling failures
“Basic sample design is no longer sufficient for reliable insights. The analytical layer is where credibility is built or lost.”
Expert survey programming and transforming strategic consulting through data science both depend on this same evolution. Polling has become a data science discipline, and treating it as anything less is a recipe for error.
Core analytics techniques: From weighting to MRP
Understanding polling’s analytical backbone leads naturally to a breakdown of the exact methods changing the game. Each technique solves a specific problem. Knowing when to use which one is where real expertise lives.
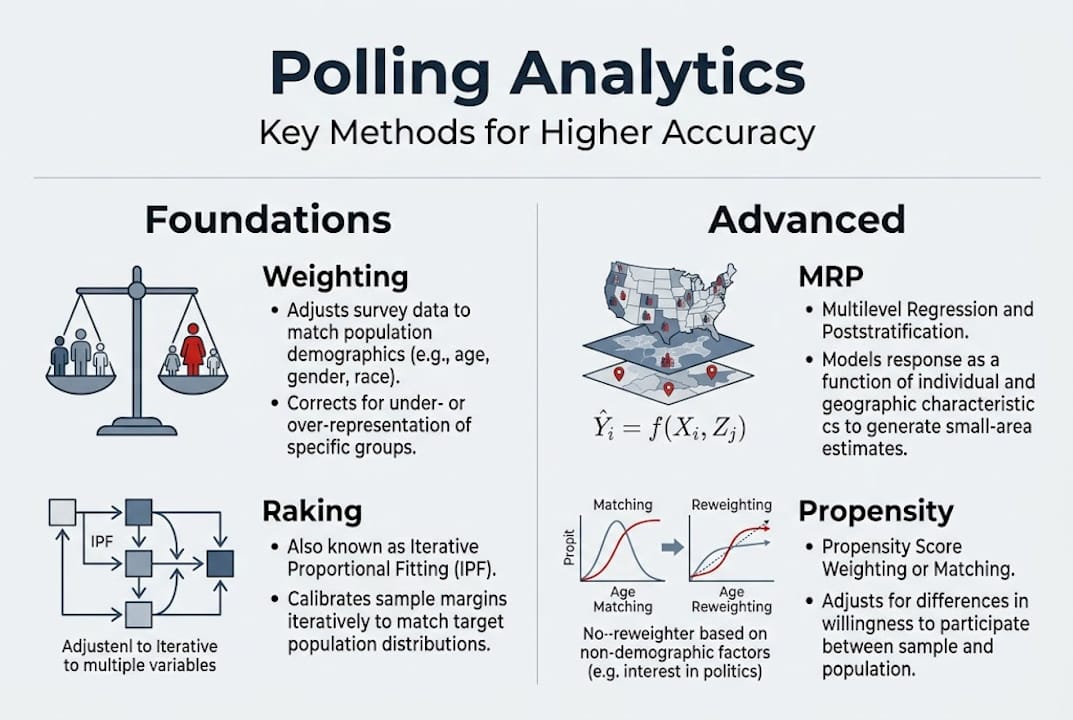
Weighting is the foundation. It adjusts sample composition to match known population parameters. Raking, also called iterative proportional fitting, adjusts across multiple variables simultaneously until the sample aligns with benchmarks. Propensity score weighting estimates the probability that a given respondent would be included in the sample, then adjusts accordingly. Matching pairs respondents to population records based on shared characteristics.

MRP goes further. It builds a multilevel regression model using individual-level predictors, then post-stratifies the predictions across population cells defined by census data. The result is reliable estimates even from samples that would otherwise be too small to trust. Statistical advancements in polling confirm that MRP and weighting are the most powerful tools for correcting bias in non-probability samples like online panels.
Here is how the main techniques compare:
| Technique | Best use case | Key strength | Key limitation |
|---|---|---|---|
| Raking | Large panels with known benchmarks | Fast and flexible | Assumes independence across variables |
| Propensity scoring | Non-probability samples | Corrects self-selection | Requires strong auxiliary data |
| MRP | Subnational or small-sample estimates | High accuracy with small N | Complex to build and validate |
| Matching | Experimental or quasi-experimental designs | Controls for confounders | Can introduce imbalance if done poorly |
Here is how to think about choosing a method:
- Start with the sample type. Probability samples need less correction than non-probability panels.
- Assess auxiliary data availability. MRP needs rich census-level data to post-stratify against.
- Consider your sample size. MRP shines with small samples. Raking works better with large ones.
- Validate against 2024 polling accuracy benchmarks to check your model’s real-world performance.
Pro Tip: No single method eliminates all bias. The best analysts layer techniques, using raking to align demographics and MRP to handle geographic variation, then cross-validate against empirical benchmarks. Data quality in online surveys is the foundation everything else rests on.
Addressing edge cases: Risks and limitations of analytics in polling
Core analytics work most of the time, but it is in the exceptions and failures that real lessons for practitioners emerge. And there are plenty of failures worth studying.
Selection bias is the most persistent threat. Non-probability online panels attract respondents who are systematically different from the general population. They tend to be more politically engaged, more digitally active, and more opinionated. When a panel skews this way, no amount of weighting fully corrects the distortion. The 2016 US election and the 2023 Turkey election are textbook cases where selection bias in non-probability samples drove significant polling errors.
Turnout modeling is another common failure point. Many pollsters rely on self-reported likelihood to vote, asking respondents how likely they are to cast a ballot. The problem is that people overestimate their own civic participation. Demographic predictors like age, education, past voting behavior, and registration status are far more reliable than self-reports for modeling who actually shows up.
Common risks analysts should monitor:
- Over-relying on small or geographically unrepresentative samples
- Assuming that weighting corrects for all forms of non-response bias
- Treating model outputs as ground truth without validation
- Ignoring shifts in the electorate between past elections and current ones
- Failing to account for late-breaking events that change voter sentiment
Statistic to keep in mind: The average absolute error in US polls before advanced analytics adoption was significantly higher than the 3.3 percentage point figure seen in 2024. Progress is real, but the floor is not zero.
Pro Tip: Cross-validate your models against empirical benchmarks from past elections before trusting them for current predictions. False security in a well-built model is still false security. Survey verification methods can help you catch problems before they become headlines.
Propensity modeling and dynamic response propensity (DRP) techniques offer partial solutions to selection bias, but they require strong auxiliary data to work well. When that data is thin, so is your confidence interval.
AI and advanced analytics in poll interpretation
With risks and edge cases in mind, it is essential to look at the latest advances, especially AI’s role in interpreting polling data. The technology is genuinely exciting. It is also genuinely risky when misapplied.
AI models can aggregate dozens of polls simultaneously, blend historical data with current survey results, and generate probabilistic forecasts at a speed no human team can match. That is a real capability gain. But aggregating multiple polls is more complex than it sounds, involving assumptions about distributions, how much weight to give older data, and how to handle polls with different methodologies.
The risks are specific and worth naming:
- Overfitting: AI models trained on past election data may learn patterns that do not generalize to new elections with different dynamics.
- Amplification of micro-trends: Over-reliance on a small number of recent polls can amplify noise rather than signal.
- Carryover bias: Blending historical data without adjusting for structural changes in the electorate distorts current estimates.
- Opaque weighting: AI-driven aggregators sometimes apply weights that are not transparent, making validation difficult.
“The risk is not that AI gets polling wrong. The risk is that AI gets polling wrong confidently, and no one questions it because the model looks sophisticated.”
Solutions exist. Transparent reporting of model assumptions, ensemble approaches that blend multiple methods, and regular back-testing against known outcomes all reduce AI-related interpretation risk. AI in market research is evolving fast, and AI-powered sentiment analysis offers complementary tools for reading public opinion beyond simple vote intention.
The expert polling guidance from AAPOR’s 2024 task force is clear: AI tools add value when layered onto rigorous methodology, not when used as a substitute for it.
A fresh look: What most polling analyses miss
Here is something we see often, and it is worth saying plainly. The conversation about polling accuracy gets dominated by method debates. MRP versus raking. Probability versus non-probability samples. AI aggregation versus traditional averaging. These are real debates, and they matter. But they can also become a distraction from more fundamental issues.
Data quality is the variable that analytics cannot fix after the fact. If your panel is contaminated with inattentive respondents, if your questionnaire primes certain answers, or if your fielding window misses key demographic groups, no model rescues you. We have seen organizations invest heavily in sophisticated analytics while underinvesting in the basics of data-driven insights and foundational data hygiene.
Overconfidence in modeling is the other trap. A well-specified MRP model can feel like certainty. It is not. Successful pollsters blend analytical rigor with deep contextual knowledge, especially around turnout dynamics and shifting electorates. The model tells you what the data says. Context tells you whether to trust it.
Put analytics to work in your organization
Armed with a deeper understanding of analytics’ role in polling, you might be wondering how to apply these lessons to your own research and organizational needs. That is exactly where we come in.
At Veridata Insights, we work with market researchers and data analysts who need more than off-the-shelf survey tools. We bring expertise in weighting, MRP, data quality validation, and AI-assisted interpretation to every engagement. Whether you need a full-service research partnership or targeted analytical support for a specific project, we are ready seven days a week, 365 days a year, with no project minimums. Connect with Veridata Insights and let us help you build polling and research that you can actually trust.
Frequently asked questions
What is the most important analytic method for polling accuracy?
Weighting and MRP are the most influential techniques, dramatically improving representativeness when used with high-quality auxiliary data. Neither works well without solid underlying data.
Why did some polls fail in recent elections despite advanced analytics?
Polls sometimes fail due to selection bias in non-probability samples or unvalidated turnout models, regardless of the analytics applied. The 2016 US and 2023 Turkey elections are clear examples.
How does AI contribute to polling analysis?
AI tools aggregate and interpret complex polling datasets at scale, but they require careful validation to avoid amplifying bias or overfitting to historical trends.
Is polling now more accurate because of analytics?
Yes, advanced analytics have reduced average polling errors, with 2024 US polls showing a 3.3 percentage point average absolute error. But accuracy still depends on sample quality and transparent methods.
Recommended
- Harnessing AI and Advanced Analytics in Market Research for Consulting Firms – Veridata Insights
- How Data and Analytics Are Transforming Strategic Consulting – Veridata Insights
- In-Depth Interview Recruiting: Why Veridata Insights Leads the Way in Quality Respondent Engagement – Veridata Insights
- How Veridata Insights Helps Consulting Firms Deliver Transformative Insights – Veridata Insights
- Haal meer uit je website: de basis van web analytics


