TL;DR:
- Effective courtroom visuals clarify complex evidence and support case narratives by making information accessible to jurors unfamiliar with technical details. Integrating visual strategy early, testing for comprehension, and ensuring strict adherence to evidentiary rules are essential for impactful, admissible graphics. Prioritizing clarity over aesthetics and carefully managing legal risks enhances the persuasiveness and integrity of visual evidence throughout litigation.
Lawyers are trained to argue with words. But juries think in pictures. That gap is exactly where cases get won or lost, and understanding data visualization for litigators explained in practical terms can change how you build and present your entire case. A well-designed timeline or chart does not just make your argument look polished. It makes complex evidence comprehensible to twelve people who have never read a contract, reviewed medical records, or tracked financial fraud in their lives. This guide covers the tools, legal rules, design principles, and strategic timing that separate visuals that help from visuals that hurt.
Table of Contents
- Key Takeaways
- Data visualization for litigators explained: the core framework
- Designing visuals that hold up in court
- Using visuals across the entire litigation timeline
- Pitfalls that can derail your visual strategy
- My take on where legal visualization goes wrong
- How Veridatainsights supports litigators with data visuals
- FAQ
Key Takeaways
| Point | Details |
|---|---|
| Visuals clarify, they don’t replace evidence | Every courtroom visual must link directly to underlying proof or risk exclusion under Rule 403. |
| Know the Rule 107 distinction | Illustrative aids and demonstrative evidence carry different legal statuses and jury access rights during deliberations. |
| Plan visuals early in case strategy | Integrating visual design from the start aligns graphics with your case theme and reduces last-minute admissibility problems. |
| Design for non-expert viewers | Testing visuals with people outside the case catches comprehension gaps before jurors do. |
| Document everything on the record | Clearly stating a visual’s status as an illustrative aid versus evidence protects you on appeal. |
Data visualization for litigators explained: the core framework
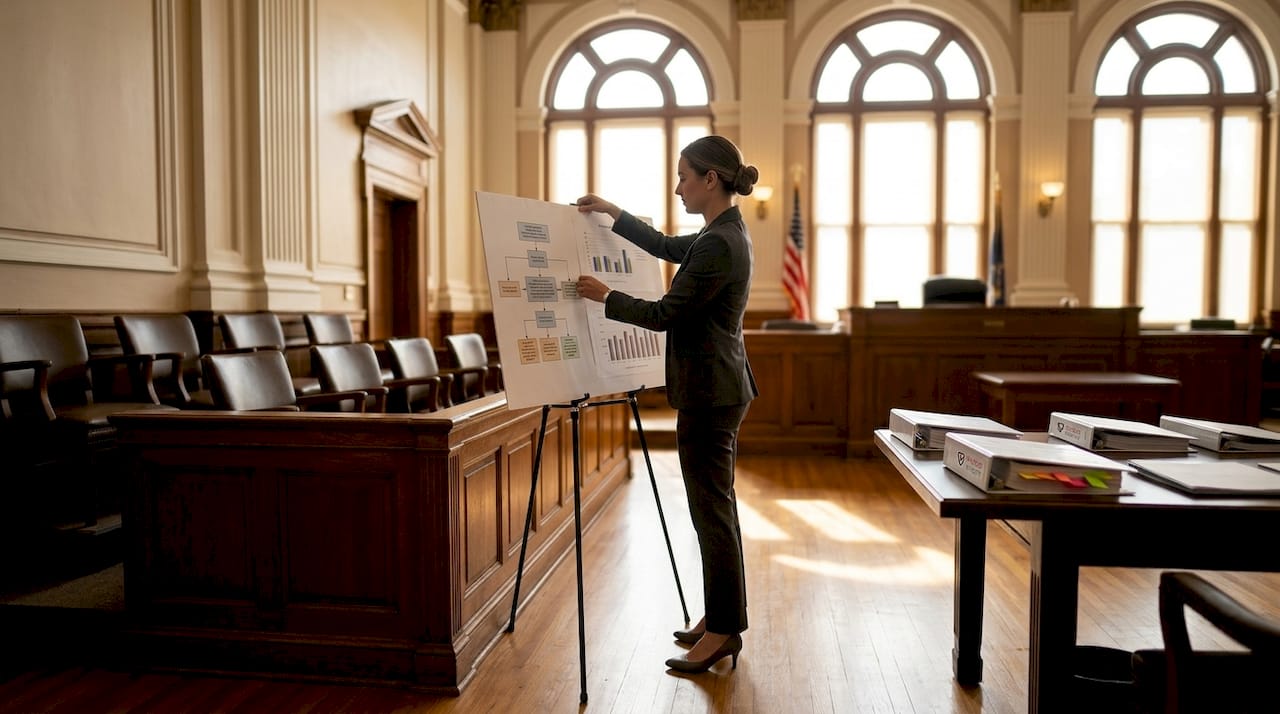
Most litigators already use some form of visual aid. The question is whether those visuals are doing real work or just filling a slide. Trial graphics such as legal timelines, document callouts, and medical illustrations help jurors follow complex evidence and support case narratives across every stage of trial. That is not decoration. That is cognition management.
The main formats you will actually use
The four workhorses of courtroom visualization are timelines, charts and graphs, diagrams, and document callouts. Timelines sequence events so jurors can place facts in a logical story. Charts summarize data that would take pages of testimony to explain verbally. Diagrams show spatial or mechanical relationships, especially useful in product liability or construction disputes. Document callouts enlarge and highlight key text within contracts, emails, or reports so jurors can follow along while a witness reads aloud.
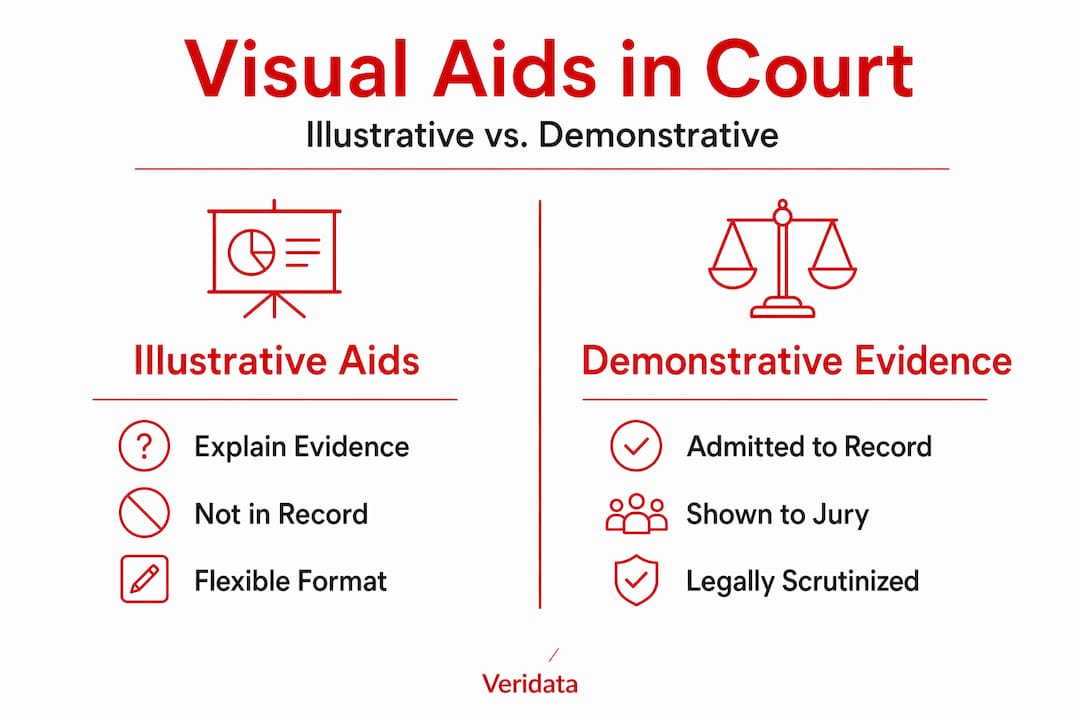
Illustrative aids vs. demonstrative evidence
This distinction matters legally, not just semantically. Demonstrative evidence is admitted into the record and can go to the jury room. Illustrative aids are used to explain testimony but are not offered as evidence and typically stay out of deliberations unless the court or opposing counsel consents. Getting this wrong creates real appellate exposure.
The governing rules are clear. Federal Rule of Evidence 107 allows illustrative aids when their utility outweighs their risks, applying a balancing test under Rule 107(a) and restricting jury access during deliberations under Rule 107(b). Rule 403 permits exclusion when probative value is substantially outweighed by unfair prejudice or the risk of misleading the jury. Both rules require you to think about your visuals the way you think about your witnesses: prepared, credible, and defensible.
Evidentiary hygiene here is not optional. Visuals must clarify, not substitute or distort proof, or you risk exclusion or jury access limits that can undercut your whole presentation strategy.
Designing visuals that hold up in court
Good design for courtrooms is not about aesthetics. It is about instant clarity. Jurors should grasp the meaning of a visual within seconds. If they are still trying to decode it while a witness is talking, you have lost them.
The practical criteria for a courtroom-ready visual:
- Snapshot clarity: Show the visual to someone unfamiliar with the case for ten seconds and ask what they learned. Testing for comprehension gaps before trial and refining based on where understanding fails is one of the most underused practices in litigation prep.
- Direct evidence links: Each timeline entry, data point, or diagram element should connect to an underlying exhibit or testimony. Interactive timelines with evidence anchors reduce cognitive load by showing jurors why each date or fact matters, not just that it exists.
- Audience-appropriate format: Research shows that graph comprehension varies by viewer age, and selecting the right visual type can double correct comprehension responses. A pie chart works fine for market share. For a multi-year fraud pattern, a line graph with annotated events tells a far clearer story.
- Consistent labeling: Every axis, column, and callout needs a plain-English label. Abbreviations that legal teams use daily mean nothing to a juror from outside the industry.
- Display compatibility: In hybrid courtrooms, your visuals must remain legible across multiple formats including monitors, projectors, and remote video feeds. Design at scale and test on actual screens before trial.
Pro Tip: Keep a contemporaneous log of every revision to your trial graphics, including who requested the change and what evidence justified it. This record becomes your foundation for admissibility arguments and appellate protection.
One thing attorneys often miss: the moment you simplify a visual to make it more readable, you must verify it still accurately represents the underlying data. A chart that rounds numbers, omits outliers, or collapses time periods may be easier to read but easier to attack. Accuracy and clarity have to move together.
Using visuals across the entire litigation timeline
Data visualization techniques for lawyers are most effective when they are not bolted on at the last minute. The best trial teams treat visual strategy as part of case development from day one.
Here is how effective data presentation for attorneys looks across the litigation lifecycle:
- Early case assessment. Visual strategy should begin when you first map the evidence. Proactively identifying what jurors will not understand without visuals helps you plan discovery around filling those gaps. A financial dispute with thousands of transactions needs a summary chart as a strategic priority, not an afterthought.
- Theme development. Before opening statements, your core visual should already reflect your case theme. A single compelling graphic, a clean chronology or a before-and-after comparison, primes jurors to receive testimony in the frame you have built.
- Opening statements. This is where visuals do heavy lifting. Jurors are forming their first impressions and have no context yet. A clear, well-labeled timeline or overview diagram during opening gives them a mental map they will carry through weeks of testimony.
- Witness examination and expert testimony. Early collaboration with trial graphics firms confirms that visuals reflect documents and testimony accurately. When an expert points to a chart they helped validate, it carries more weight than a slide created by the legal team alone.
- Closing arguments. Visuals used in closing should revisit and reinforce what jurors have already seen. Do not introduce new information here. Layer in the evidence you have already established. A timeline that started simple in opening can now carry annotations from trial testimony, showing jurors that the story you promised held together.
The through-line is consistency. Jurors who see the same visual framework evolve across the trial develop confidence in the narrative. Each graphic reference becomes a callback that reinforces your theme without you having to restate it.
Pitfalls that can derail your visual strategy
Even well-designed visuals can create legal problems if you are not careful about how they are framed, disclosed, and marked.
The most common risks include:
- Unfair prejudice or jury misleading. A visual that exaggerates scale, omits context, or presents inference as fact is vulnerable to Rule 403 objections. Specific, well-framed objections that identify the precise type of unfair prejudice and propose less prejudicial alternatives succeed. Generic objections do not. Know this from both sides of the table.
- Substituting visuals for actual evidence. A chart summarizing financial data must connect to the underlying financial records admitted into evidence. Visuals that stand alone as the only proof of a fact will not survive a challenge.
- Failing to create a clean record. Stating on the record whether a visual is an illustrative aid or substantive evidence is not procedural busywork. It is appellate protection. Courts have reversed verdicts when this line was blurred.
- Disclosure and advance notice. Many courts require pre-trial disclosure of demonstrative aids. Missing these deadlines can get your best visuals excluded on the morning of trial.
“Visuals should make the record clearer, not the story prettier. When a graphic is too persuasive to be honest, it has stopped helping the jury understand and started trying to replace their judgment.”
Managing these risks starts with judicial collaboration. Talk to the court early about how you intend to use visuals. A brief conference about framing and marking procedures can prevent objections that would otherwise consume trial time.
My take on where legal visualization goes wrong
I have reviewed a lot of case materials across industries, and the pattern that keeps appearing in litigation is this: visuals are treated as a production task rather than a strategic one. Someone on the team is assigned to “make the slides” in the final weeks before trial, and what gets created reflects the evidence that is easy to visualize rather than the evidence that needs to be visualized.
What I have learned is that the most effective trial visuals come from a simple question asked very early: “What will a juror find genuinely confusing here?” Not what is legally complex. Not what is factually dense. What is humanly confusing to someone without your background.
The answer to that question drives everything. It drives which chart type you select. It drives how you label axes. It drives whether you use a static image or an interactive layered timeline. When I see visuals that actually translate research into clear presentations, the teams behind them treated clarity as the goal from the very first sketch.
Technology is raising the stakes here, too. AI-generated courtroom visuals are increasingly available, and they require careful handling. AI-generated evidence in court demands expert-demonstrative grounding, authentication, and readiness to explain the methodology on the stand. The tool does not change the standard. The visual still has to be defensible.
My bottom line: design visuals that clarify your record, not visuals that substitute for it. The jury’s job is to decide. Your job is to make sure they understand what they are deciding.
— Daniel
How Veridatainsights supports litigators with data visuals
At Veridatainsights, we know that courtroom data challenges are not just about design. They are about accuracy, legal compliance, and making sure every visual earns its place in the record. Our team works with legal professionals at every stage, from early case analysis and evidence mapping through trial-ready graphics that align with Federal Rules of Evidence requirements. Whether you need a methodology review, a visual strategy audit, or full-service graphics development, we work 7 days a week with no project minimums. If your case involves data that needs to be understood by people who were not in the room when it happened, that is exactly where we do our best work. Contact Veridatainsights to discuss how we can help your team build visuals that hold up.
FAQ
What is data visualization for litigators?
Data visualization for litigators refers to the use of charts, timelines, diagrams, and other visual formats to make complex evidence understandable to judges and juries. These tools translate technical or voluminous data into clear, structured visuals that support case arguments.
What is the difference between illustrative aids and demonstrative evidence?
Illustrative aids help explain testimony but are not admitted into the record, while demonstrative evidence is formally admitted and may go to the jury during deliberations. Federal Rule of Evidence 107 governs when illustrative aids can be used and restricts jury access to them without court order or consent.
Can a visual be excluded from a trial under Rule 403?
Yes. Under Rule 403, a court can exclude a visual if its potential for unfair prejudice or misleading the jury substantially outweighs its probative value. Generic design flaws, exaggerated scales, or omitted context are common grounds for successful exclusion objections.
When should litigators start developing trial visuals?
Visual strategy should begin during early case assessment, not the weeks before trial. Early integration allows visuals to align with case themes, accurately reflect the evidentiary record, and surface comprehension gaps while there is still time to address them through discovery.
What are the best practices for legal data visualization?
Test every visual with non-expert viewers before trial, link each element directly to underlying evidence, label all components in plain language, and document every revision to the graphic. Always state clearly on the record whether a visual is an illustrative aid or substantive evidence.
Recommended
- Qualitative Research in Legal Cases: Strategy That Wins – Veridata Insights
- Survey methodology for attorneys: A practical guide
- Case Study: Data Processing & Visualization Solution For A Business Services Provider – Veridata Insights
- Why Quality Customer Service is Essential to Drive Data Visualization – Veridata Insights