

Research reporting is often treated as the final checkbox in a project, something to complete before moving on. That assumption costs businesses real money and momentum. Research reports communicate findings to decision-makers, serving as a permanent record that enables validation and drives data-driven choices across B2B and B2C sectors. The way you report your research determines whether insights gather dust or shape your next competitive move. This article breaks down the frameworks, best practices, and practical strategies that turn research reporting into a genuine business asset.
Table of Contents
- Why reports matter: More than just documentation
- Core components of an effective research report
- Best practices for clarity, transparency, and impact
- Tailoring reports and embracing new challenges
- Driving results: ROI, automation, and benchmarking
- Unlock research reporting that drives business growth
- Frequently asked questions
Key Takeaways
| Point | Details |
|---|---|
| Reporting drives decisions | Well-structured reports enable faster and more informed data-driven choices in business. |
| Structure is critical | Including essential sections and tailoring detail boosts clarity and use for all audiences. |
| Transparency builds trust | Disclosing methods, AI, and limitations ensures compliance and strengthens report credibility. |
| Automation delivers ROI | Automated reporting saves time and can increase business revenue through quicker actions. |
Why reports matter: More than just documentation
A research report is not a summary. It is a strategic artifact. When built correctly, it becomes the foundation for decisions that affect revenue, product direction, hiring, and market positioning. Treating it as a formality is one of the most expensive mistakes a business can make.
Effective research reporting communicates findings to decision-makers while functioning as institutional memory, a validation tool, and a source of competitive intelligence. It answers not just “what happened” but “what should we do next.” That shift from passive documentation to active guidance is what separates useful reports from forgettable ones.
The business impact is measurable. HP saved over 200 hours per month through automated reporting, while Company E achieved 20% revenue growth by leveraging business intelligence reporting to guide strategic decisions. These are not outliers. They reflect what happens when reporting is treated as a core business function rather than an afterthought.
“The goal of a research report is not to display data. It is to create the conditions for better decisions.”
Here is what strong reporting delivers for B2B and B2C organizations:
- Faster decisions: Structured findings reduce the time leaders spend interpreting raw data
- Institutional memory: Reports preserve research value beyond the project lifecycle
- Validation: Well-documented methodology allows findings to be verified and trusted
- Competitive intelligence: Consistent reporting reveals market trends over time
- Stakeholder alignment: Clear reports reduce miscommunication across teams and leadership levels
For teams working on B2B research best practices, the report is where methodology meets business strategy. Get it right, and the research pays dividends long after the data collection ends.
Core components of an effective research report
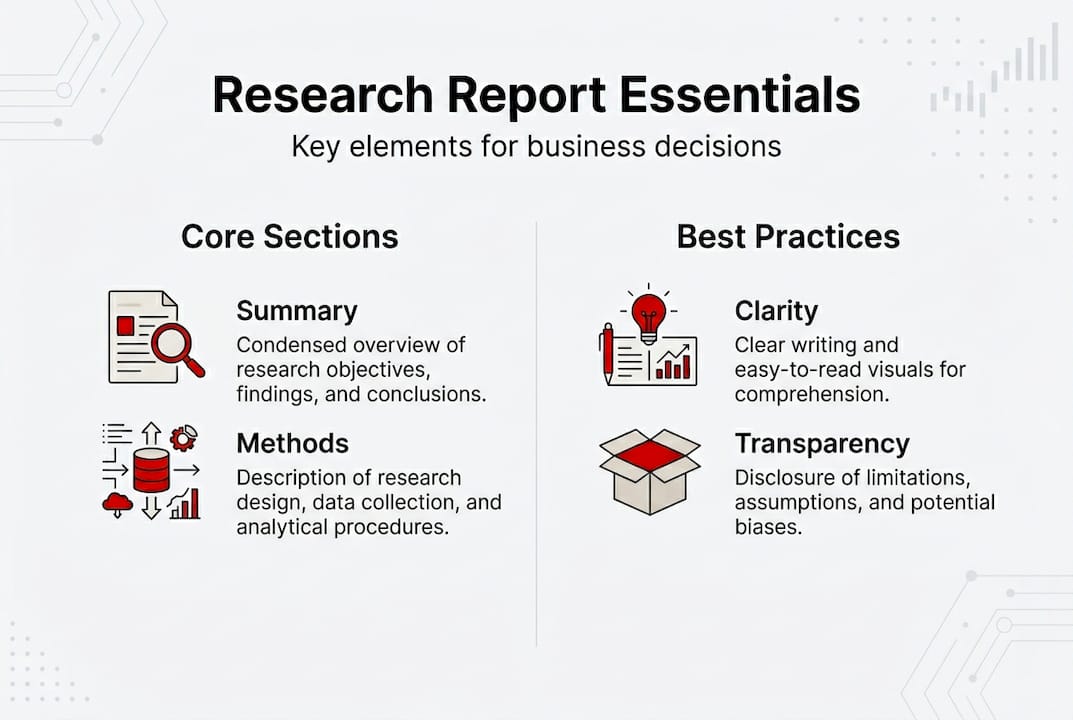
A research report without structure is just a data dump. The components you include, and the order you present them in, determine whether your audience walks away informed or overwhelmed. Key components of effective research reports include a title page, executive summary, introduction, methodology, findings with visuals, discussion, recommendations, and appendices.
Here is how each component serves a specific business purpose:
- Title page: Sets context and establishes the scope of the research
- Executive summary: Delivers the critical findings and recommendations in two pages or less
- Introduction and objectives: Explains why the research was conducted and what questions it answers
- Methodology: Describes how data was collected, who was surveyed, and what tools were used
- Findings with visuals: Presents data clearly using charts, graphs, and tables that make patterns visible
- Discussion: Interprets what the findings mean in the context of the business objective
- Recommendations: Translates insights into specific, actionable next steps
- Appendices: Houses raw data, questionnaires, and technical details for those who need them
The table below maps each component to its primary audience within a business:
| Report component | Primary audience | Primary purpose |
|---|---|---|
| Executive summary | C-suite, board | Fast decision support |
| Methodology | Research managers, analysts | Credibility and validation |
| Findings with visuals | All stakeholders | Clear data communication |
| Recommendations | Business unit leaders | Actionable direction |
| Appendices | Technical reviewers | Depth and transparency |
Understanding market research essentials helps you build reports that speak to each layer of your organization. And when your reports connect directly to research-driven strategies, stakeholders stop questioning the value of research investment.

Pro Tip: Write your executive summary last. Once you have finalized the findings and recommendations, you will know exactly which three to five points matter most to leadership. Starting with the summary often leads to vague, generic language that fails to capture the real story.
Best practices for clarity, transparency, and impact
A well-structured report can still fail if it is unclear, biased, or incomplete. The difference between a report that drives action and one that gets filed away comes down to how it is written and what it discloses. Best practices emphasize clarity, accuracy, objectivity, completeness, conciseness, logical organization, and interpretive analysis supported by visuals.
Here is a comparison of reporting approaches that succeed versus those that fall short:
| Reporting element | Effective approach | Common mistake |
|---|---|---|
| Language | Plain, direct, jargon-free | Technical language without explanation |
| Visuals | Charts tied to specific insights | Decorative graphs with no narrative |
| Methodology disclosure | Full transparency on sample and tools | Vague or omitted methodology |
| Recommendations | Specific, prioritized actions | Generic suggestions without context |
| Limitations | Clearly stated and contextualized | Buried or absent |
| AI involvement | Disclosed where applicable | Undisclosed, creating trust risk |
Transparency is not optional. The ESOMAR/ICC Code mandates full disclosure of methods, limitations, and AI use in published findings to ensure results are not misleading. This is both an ethical standard and a regulatory expectation for organizations operating in regulated markets.
Storytelling is the underrated skill in research reporting. Data without narrative is noise. When you connect a finding to a business consequence, such as showing how a 12-point drop in customer satisfaction correlates with a specific service gap, you give decision-makers a reason to act. Structure your findings as a story: context, conflict, resolution.
Pro Tip: Use the “so what” test on every finding. After each data point, ask yourself: so what does this mean for the business? If you cannot answer that in one sentence, the finding is not ready for the report.
For teams focused on collaborative research best practices, clarity and transparency in reporting also reduce friction between research and consulting teams, making it easier to align on recommendations.
Key practices that consistently improve report impact:
- Use active voice to make findings feel direct and credible
- Lead with the most important finding, not the most recent one
- Limit each chart to one key message
- Define all acronyms and technical terms on first use
- Include a limitations section to build trust, not undermine it
Tailoring reports and embracing new challenges
Not every reader needs the same report. A CFO and a data analyst are both stakeholders, but they need fundamentally different things from the same research. Tailoring reports to your audience means executives get concise summaries tied to business impact, while technical managers get the granular data and methodology they need to validate findings.
Here is a practical framework for segmenting your report content:
- Executive layer: Two-page summary with key findings, business implications, and top three recommendations
- Management layer: Full findings section with visuals, discussion, and prioritized action items
- Analyst layer: Complete methodology, raw data tables, statistical outputs, and appendices
- External stakeholder layer: Curated findings relevant to the specific audience, stripped of proprietary detail
Academic and business reporting serve different masters. Academic reports prioritize rigor, citation, and reproducibility. Business reports prioritize brevity, clarity, and action. When research managers try to apply academic conventions to business reporting, they often produce documents that are thorough but unreadable for the people who need to act on them.
“A report written for everyone is useful to no one. Segment your content, and your insights will actually land.”
Emerging challenges are reshaping what disclosure looks like in 2026. Regulations on non-research use cases require organizations to clearly disclose when research techniques are used for purposes beyond traditional research, such as AI-generated outputs or profiling. Failing to disclose these uses creates legal and reputational risk.
For teams producing client-friendly presentations, the ability to tailor content without losing accuracy is a competitive differentiator. Clients who receive reports that speak directly to their priorities are far more likely to act on the findings and return for future research.
Driving results: ROI, automation, and benchmarking
Reporting is not just a communication tool. It is a performance lever. When you measure the right outcomes and automate the right processes, reporting becomes one of the highest-return activities in your research function. Automating routine reporting and integrating real-time data gives organizations the agility to respond to market shifts without waiting for the next quarterly review cycle.
Here is a snapshot of reporting ROI metrics worth tracking:
| ROI metric | What it measures | Why it matters |
|---|---|---|
| Time saved per report cycle | Hours reclaimed through automation | Directly reduces labor cost |
| Decision speed | Days from data delivery to action | Faster decisions = competitive edge |
| Revenue impact | Growth tied to research-informed moves | Validates research investment |
| Stakeholder satisfaction | Report usefulness ratings | Drives adoption and engagement |
| Reuse rate | How often reports inform future decisions | Measures institutional memory value |
Global brands benchmark insights budgets as a percentage of revenue and marketing spend, and benchmarking consistently reveals gaps in sales productivity and decision quality that better reporting can close. Organizations that treat reporting as a cost center miss this entirely.
Key benefits of building a reporting-first research culture:
- Scalable insights: Automated dashboards surface trends without manual effort
- Real-time agility: Integrated data feeds allow reports to reflect current conditions
- Cross-functional value: Shared reporting frameworks align sales, marketing, and product teams
- Budget justification: Clear ROI metrics make it easier to defend research investment
For business leaders focused on market research for better decisions, the path forward is clear. Invest in reporting infrastructure, automate what is repeatable, and measure outcomes that connect directly to business performance.
Unlock research reporting that drives business growth
If your research reports are not consistently driving decisions, the problem is rarely the data. It is usually the reporting. At Veridata Insights, we build research programs designed to deliver findings that actually move organizations forward. From methodology design and data collection to analytics and speak with research experts who understand how to translate complex data into clear, actionable reports, we cover the full spectrum. Whether you need a single study or an ongoing research partnership, our team works with you seven days a week, 365 days a year, with no project minimums. Better reporting starts with better research, and we are ready to help you build both.
Frequently asked questions
What is the main purpose of reporting in research for businesses?
Research reporting communicates findings to decision-makers, supports data-driven choices, and preserves research as a lasting organizational resource. It bridges raw data and strategic action.
What sections should every impactful research report include?
Every strong report needs an executive summary, clear objectives, a methodology section, findings with visuals, specific recommendations, and appendices for supporting detail.
How can research reporting drive business growth?
Well-structured and automated reports improve decision speed, reduce time spent interpreting data, and support measurable outcomes. Company E achieved 20% revenue growth directly through business intelligence reporting.
What regulations or standards guide research reporting transparency?
The ESOMAR/ICC Code requires full disclosure of methods, AI involvement, and limitations to ensure findings are accurate and non-misleading for all audiences.
How should reports be adapted for executive vs. technical audiences?
Executive reports prioritize concise summaries and business impact. Technical reports include granular methodology, statistical outputs, and raw data for validation purposes.
Recommended
- How Market Research Drives Strategic Decision-Making in Consulting – Veridata Insights
- The Business Case for Investing in Market Research – Veridata Insights
- Corporate Researchers: Driving Insights for Fortune 1000 and Mid Market Companies – Veridata Insights
- Leveraging Market Research for Strategic Consulting – Veridata Insights


