Margin of error (MOE) is the plus-or-minus range around a survey result, expressed in percentage points, that accounts for the fact you sampled a subset of people rather than everyone. If a poll shows 58% support with a ±3 point MOE, the true population value most likely sits between 55% and 61%. Here’s the rule of thumb every analyst should have memorized: a sample of roughly 1,000 respondents produces a margin of error near ±3 percentage points, at 95% confidence, assuming the worst-case proportion near 50/50.
The math behind that number is one formula: MOE ≈ z × √(p(1−p)/n).
- z is the critical value tied to your confidence level (1.96 for 95%)
- p is your sample proportion
- n is your sample size
Quick stat: n ≈ 1,000 at 95% confidence typically yields a margin of error near ±3%
Key Takeaways
Margin of error quantifies sampling uncertainty as a percentage-point range, and it only holds up when the sample is probability-based, correctly weighted, and reported alongside its confidence level.
| Point | Details |
|---|---|
| MOE is a range, not a guarantee | Report it as point estimate ± MOE at a stated confidence level, never as a bare percentage. |
| Sample size has diminishing returns | Quadrupling n only halves MOE, so budget for precision accordingly. |
| p = 0.5 is the conservative default | Use it when the true proportion is unknown, since it produces the widest possible MOE. |
| Subgroups need their own MOE | Never apply the topline margin of error to a smaller subsample. |
| Standard MOE requires probability sampling | Non-probability panels need a credibility interval, not a classic MOE claim. |
Table of Contents
- What Inputs Does a Margin of Error Calculator Need?
- How Do You Calculate Margin of Error for a Proportion?
- What Changes the Margin of Error?
- How Should You Interpret and Report Margin of Error?
- When Doesn’t Standard Margin of Error Apply?
- Which Online Calculators Handle Margin of Error?
- Sources
What Inputs Does a Margin of Error Calculator Need?
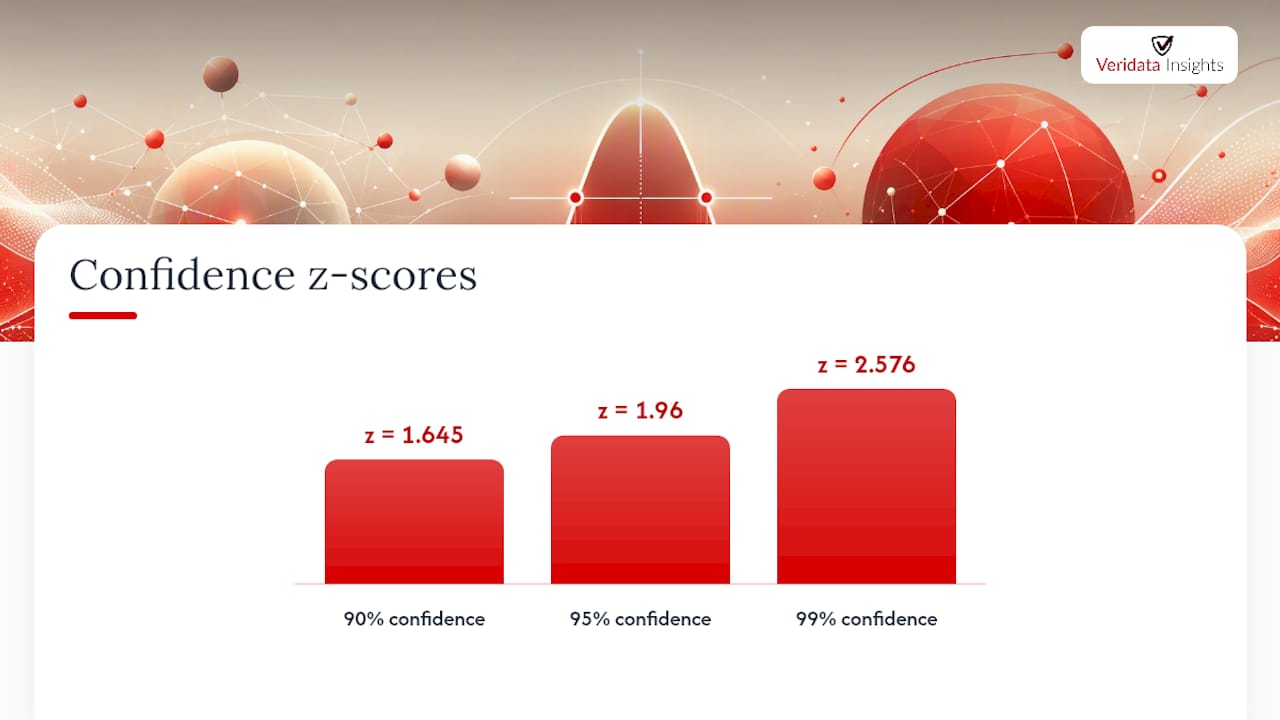
Every margin-of-error calculator, whether it’s a free web tool or a spreadsheet you build yourself, asks for the same three things: sample size (n), sample proportion (p, sometimes shown as p-hat), and confidence level. The confidence level determines which z-score gets plugged into the formula, and it’s worth keeping a copy of the standard values handy.
| Confidence Level | Z-Score |
|---|---|
| 90% | 1.645 |
| 95% | 1.96 |
| 99% | 2.576 |
Two optional inputs matter more than most people realize. Population size triggers the finite population correction when you’re sampling a large chunk of a small group (think: surveying 400 people out of a population of 1,500). Design effect (DEFF) and weighting adjustments matter whenever your sample isn’t a simple random draw, which describes most real-world panels.
How Do You Calculate Margin of Error for a Proportion?
Here’s the full walkthrough, from raw numbers to a reportable figure.
- Start with the formula: MOE = z × √(p(1−p)/n)
- Pick your z-score based on confidence level (1.96 for 95%, the industry default)
- Plug in p, your observed proportion as a decimal (52% becomes 0.52)
- Plug in n, your total valid sample size
- Calculate p(1−p)/n, then take the square root, then multiply by z
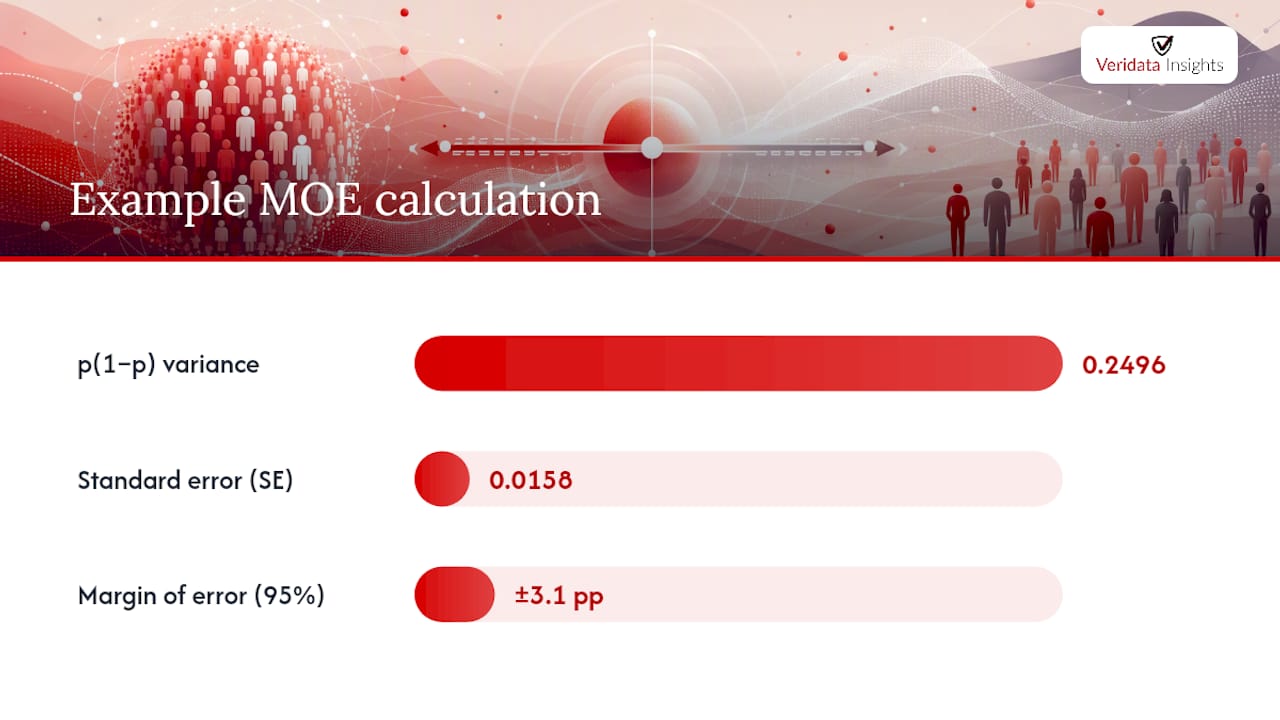
Worked example: say you surveyed 1,000 people and 52% picked “Yes.”
- p(1−p) = 0.52 × 0.48 = 0.2496
- 0.2496 / 1,000 = 0.0002496
- √0.0002496 = 0.0158
- 0.0158 × 1.96 = 0.031, or approximately ±3.1 percentage points
You’d report that result as “52%, ±3.1 points at 95% confidence.”
A useful shortcut: when p is unknown, use p = 0.5. It’s the most conservative setting because p(1−p) peaks at 0.25 exactly when p equals 0.5, giving you the widest possible MOE for a given n. That’s where the “0.98/√n” and “1/√n” shortcuts for 95% confidence come from.
Working backward, the sample-size formula for a target MOE is n = z² × p(1−p) / MOE². In Excel, compute z with =NORM.S.INV(0.975) for a 95% two-tailed interval, then feed that result into the formula manually or in a linked cell.
What Changes the Margin of Error?
Three levers control MOE, and understanding them saves you from expensive surprises mid-project.
- Sample size follows an inverse square-root relationship: to cut your MOE in half, you need four times the sample, not double it. This trips up stakeholders who assume linear returns on research budget.
- Sample proportion (p) matters because MOE peaks at p = 0.5 and shrinks as results move toward extremes. A 90/10 split produces a much tighter MOE than a 50/50 split at the same n.
- Confidence level trades certainty for precision. Moving from 90% (z = 1.645) to 99% (z = 2.576) widens your interval by more than 50%, even though your data hasn’t changed.
Two design factors inflate MOE beyond the textbook formula. Design effect (DEFF) accounts for clustering, stratification, or unequal selection probabilities, and weighting to match population demographics almost always increases effective variance. Finite population correction shrinks MOE slightly when your sample represents a large share of a small, defined population.
Pro Tip: *Always calculate MOE separately for subgroups.
How Should You Interpret and Report Margin of Error?
Report every finding as “point estimate] ± [MOE] percentage points at [confidence level].” Never state MOE without naming the confidence level attached to it, and never apply it to a [non-probability sample without a caveat.
To judge whether a gap between two results is meaningful, compare the difference to the combined standard error of both figures rather than eyeballing the topline MOEs. A rough rule: if two results differ by less than the sum of their individual MOEs, treat the difference as a statistical tie until you can compute the standard error of the difference directly.
When writing up results:
- Disclose sample size, confidence level, and MOE together, every time
- Flag any design effects or weighting schemes applied
- Report subgroup MOEs separately, never borrow the topline figure
It describes how often the method produces a correct interval across repeated sampling.
When Doesn’t Standard Margin of Error Apply?
The classic MOE formula assumes probability-based sampling, full stop. Once you’re working with an opt-in panel, a river-sample, or a convenience recruit, the calculation stops being valid, and reporting a precise ± figure on that kind of data overstates your certainty. The honest alternative is a credibility interval, which is not interchangeable with a true margin of error and shouldn’t be labeled as one.
Weighting and design effects push the same warning further: heavily weighted data can carry an effective MOE well above what the raw sample size suggests, so reporting the design effect or effective sample size alongside your headline number is good practice, not overkill.
- Bootstrap the interval when classical assumptions break down (small n, heavy clustering)
- Compute a design-effect-adjusted MOE for weighted data
- Loop in a methodology review before publishing precision claims you can’t defend
Getting the sampling frame right is what makes any of this math meaningful in the first place. Veridata Insights builds survey and sampling methodology around exactly this problem: matching the design to the claim you actually want to make.
Which Online Calculators Handle Margin of Error?
Three tools cover most practitioner needs. The Qualtrics margin of error calculator walks through sample size, proportion, and confidence level with a step-by-step breakdown, useful when you want to see the math, not just the output. The SurveyMonkey margin of error calculator is built for a fast topline check during fielding. The SmartSurvey margin of error calculator works well for sample-size planning before launch.
Sources
- AAPOR standard definitions
- The margin of error explained — University of Melbourne
- Margin of Error Guide & Calculator — Qualtrics
- Confidence intervals and levels — UConn