Survey harmonization is the set of procedures that make two or more survey datasets comparable enough to analyze together, whether that means mapping questionnaire items, recoding values, or aligning metadata across waves and countries. The retroharmonize documentation frames this cleanly: ex-ante harmonization designs instruments for comparability before data collection begins, while ex-post harmonization retrofits comparability onto surveys that were never designed to match. Our guardrail at Veridata Insights is simple. Prefer ex-ante whenever you control instrument design. When you don’t, and you’re stuck reconciling legacy datasets, follow a reproducible ex-post pipeline instead of improvising recodes on the fly.
Two things separate a defensible harmonization from a fragile one:
- Every transformation gets logged, not just performed.
- The workflow follows a fixed order: inventory, map, recode, merge, validate.
Ex-post harmonization genuinely expands what comparative research can do, but the 2021 special issue on ex-post harmonization is blunt about the tradeoff: it’s methodologically demanding and prone to bias when transformations aren’t documented rigorously. AAPOR’s best practices push the same point from a different angle, insisting on transparency across weighting, sample construction, and variable definitions so secondary users don’t misread your integrated data.
Key Takeaways
Survey harmonization succeeds when researchers prioritize ex-ante design, document every transformation, and validate distributions before trusting any pooled analysis.
| Point | Details |
|---|---|
| Prefer ex-ante design | Build comparability into instruments before fielding whenever you control the design process. |
| Map labels, not just codes | The same numeric code can mean different things across surveys, so match full value labels. |
| Use scripted, reproducible tools | Packages like retroharmonize and schema-driven tools like ReproSchema keep harmonization auditable. |
| Validate before you trust the merge | Compare distributions by source and cross-tabulate against demographic anchors before analysis. |
| Get vendor support for complex projects | Veridata Insights handles multi-country, hard-to-reach harmonization projects with full-service consultation and programming. |
Table of Contents
- What Is Survey Harmonization, Exactly?
- How Do You Actually Run a Harmonization Project?
- Which Tools Support a Reproducible Harmonization Pipeline?
- What Pitfalls Introduce Bias Into Harmonized Data?
- When Should You Harmonize, Exclude, or Treat Data Separately?
- When Does a Harmonization Project Need a Full-Service Partner?
- How Do You Handle Missing and Special Values Across Surveys?
- What Ethical and Privacy Issues Come Up in Harmonization Work?
- How Do You Reconcile Different Sampling Frames and Survey Designs?
- How Do You Harmonize Longitudinal Survey Data Over Time?
- Get Hands-On Support for Your Next Harmonization Project
- Sources
What Is Survey Harmonization, Exactly?
Harmonization and standardization get used interchangeably, and that’s a mistake. Standardization means forcing identical procedures, instruments, or coding schemes across all data sources from the start. Harmonization is broader and more forgiving. It means achieving comparability even when the underlying instruments differ, through deliberate mapping and recoding rather than uniform collection. You can standardize a single multi-country study by using one questionnaire everywhere. You harmonize when you’re stitching together five national surveys that were never coordinated.
Metric equivalence is the actual target you’re aiming for. It’s the property that a harmonized variable measures the same underlying concept, at a comparable scale, regardless of source survey. A five-point life satisfaction scale from one country and a ten-point scale from another might both capture “life satisfaction,” but without careful rescaling and construct validation, comparing raw scores is meaningless.
The ex-ante versus ex-post distinction matters because it changes what’s recoverable. Ex-ante harmonization, as the retroharmonize project describes it, prevents heterogeneity by design, since every participating survey uses aligned question wording, response categories, and metadata from day one. Ex-post harmonization has to recover comparability after the fact, working with whatever heterogeneity already exists in the source files.
Before you write a line of recode syntax, get comfortable with a few structural terms:
- Source variables are the original items as they exist in each dataset, with their own codes, labels, and quirks.
- Target variables are the harmonized outputs you’re building toward, with one consistent coding scheme.
- Concept mapping is the documented link between a source variable and the target concept it feeds, including notes on where the match is imperfect.
- Metadata covers variable labels, value labels, missing-value codes, and question wording. All of it needs to travel with the data, not live in a separate memo nobody reads.
How Do You Actually Run a Harmonization Project?
A harmonization project fails most often not from bad recoding but from skipping steps or doing them out of order. The workflow below follows the sequence that keeps a project auditable from the first file import to the final merged dataset.
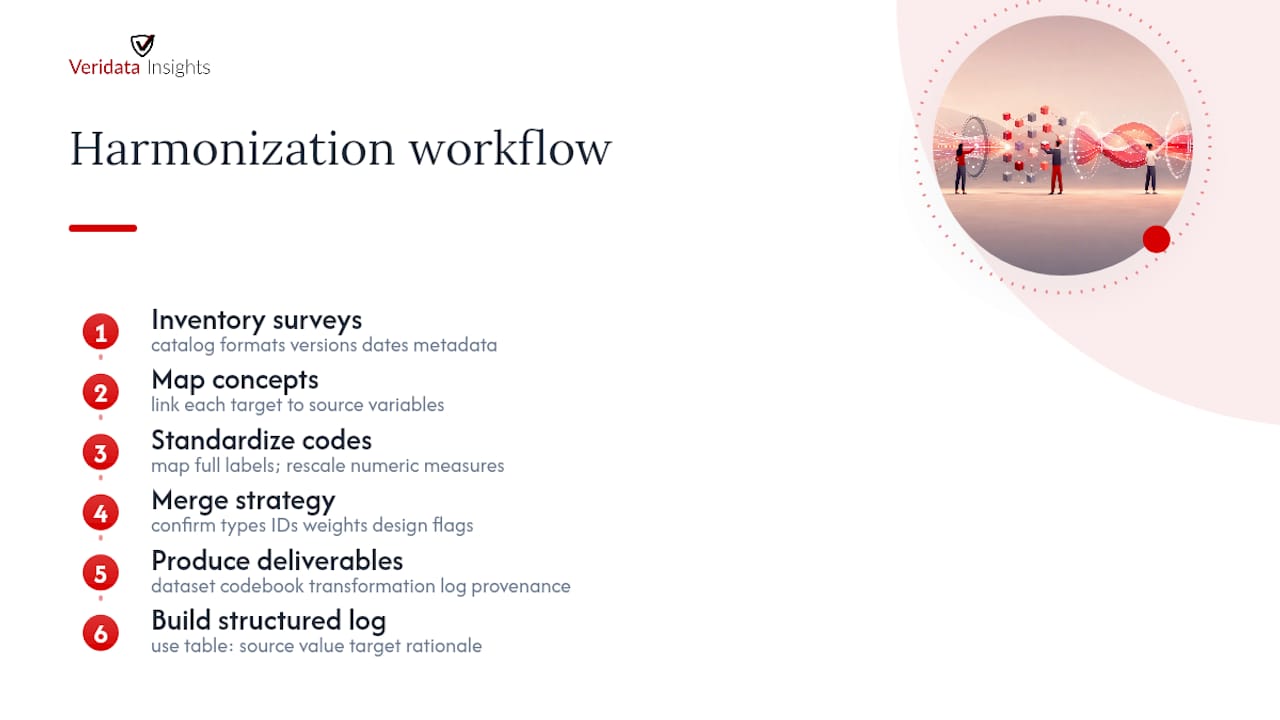
1. Inventory your surveys and their metadata. Before touching a single variable, catalog what you’re working with: file formats (SPSS, Stata, CSV, proprietary exports), questionnaire versions, fielding dates, and whatever codebooks exist. Note which surveys have machine-readable metadata and which only have a PDF questionnaire from 2011. This inventory becomes your project’s ground truth, and skipping it is how teams discover halfway through a merge that two “identical” variables were fielded three years apart under different question wording.
2. Map concepts to source variables. For every target concept, identify which source variable in each survey feeds it. Where the match isn’t clean, write down exactly how it diverges. Say one survey asks about household income with eight brackets and another asks with a continuous entry field. That’s not a footnote. It’s a substantive limitation that belongs in your documentation and possibly in your sensitivity analysis later.
3. Standardize codes and labels, not just numbers. This is where most harmonization work actually happens. You’re not just renumbering values. Per the retroharmonize vignette, the safest approach is to map full value labels (source code plus source label, mapped to target code plus target label) rather than trusting that “code 2” means the same thing across files. Rescale numeric measures onto a common range when needed, and derive any composite indicators using a documented, repeatable formula.
4. Merge with a defined strategy. Before concatenation, confirm every merging variable has consistent types across sources, that key variables (respondent ID, wave, country) align, and that you’ve got a plan for sample and weight harmonization. Clustered or stratified designs from different surveys don’t automatically combine. You’ll often need to rescale weights or flag design effects explicitly rather than pooling blindly.
5. Produce your four deliverables. A finished harmonization job outputs more than a merged file. You need the harmonized dataset itself, a harmonized codebook describing every target variable, a transformation log recording every recode decision, and a provenance file tracing each observation back to its source survey and wave.
Pro Tip: Build your transformation log as a structured table, not a prose memo. Columns for source variable, source value, target variable, target value, and rationale turn your log into a machine-readable artifact you can rerun, audit, or hand to a co-author without a walkthrough call.
Which Tools Support a Reproducible Harmonization Pipeline?
Manual recoding in a spreadsheet doesn’t scale past two or three surveys, and it leaves no audit trail. That’s the gap that scripted, tool-based pipelines close.
The retroharmonize R package is built specifically for this problem. It imports survey data and metadata directly into R classes, helps you map metadata across files, and harmonizes coding and labels through reproducible, scriptable functions rather than manual edits. Combined with labelled, haven, and the broader tidyverse, retroharmonize lets you keep variable and value labels attached to your data through the entire pipeline, not just in the original SPSS file. That matters because label loss is one of the most common and least visible sources of harmonization error.
A different strategy prevents the harmonization problem before it starts. Schema-driven approaches like ReproSchema standardize survey structure and metadata at the point of collection, so multiple studies are comparable by construction rather than by later cleanup. According to ScienceDirect’s coverage of the ReproSchema ecosystem, this kind of upfront standardization, paired with version control, reduces how much post-hoc harmonization a project needs later. If you’re designing a new multi-site study rather than reconciling old ones, this is the more efficient investment, and it pairs well with the instrument-design habits covered in our survey design best practices guide.
Metadata storage deserves its own discipline. Keep variable and value labels in a structured, non-proprietary format. Log every transformation with a timestamp and rationale. When possible, assign a DOI or use JSON-LD to make your harmonized dataset’s provenance citable and traceable independent of your own file system.
Version control isn’t optional once more than one person touches the pipeline. Put your recoding scripts in Git. For the data itself, use something like git-lfs or a formal data registry rather than emailing spreadsheets. Write unit tests for your recodes, specifically checks that assert category frequencies stay within an expected tolerance after each transformation, so a silent recoding error doesn’t propagate three merges downstream before anyone notices.
File format traps cause more damage than they should. Exporting a labelled SPSS file to plain CSV strips value labels and leaves you with bare integers and no way to reconstruct what they meant. Import labelled formats directly into R using haven or retroharmonize’s import functions, and only flatten to CSV as a final, documented export step, never as an intermediate one.
What Pitfalls Introduce Bias Into Harmonized Data?
The single most common harmonization error is trusting numeric codes without checking their labels. The retroharmonize documentation flags this directly: the same code, say, “2,” can mean “disagree” in one survey and “somewhat agree” in another. Mapping numbers instead of labels is how silent, hard-to-detect errors enter a merged dataset.
Type coercion is the second major failure point. When you combine factors, numeric variables, and labelled classes without normalizing them first, R (or any statistical software) will often coerce silently, sometimes turning a categorical variable into a meaningless numeric one. Convert every source variable into a consistent labelled class before merging, and check the result against the original.
Bias creeps in less obviously through arbitrary collapsing, like folding a six-category education variable into three categories because that’s what the other survey has. Every collapsing decision is a modeling choice, and it deserves a sensitivity analysis, not a shrug. Run your key analyses both ways when feasible, and report if conclusions shift.
A few validation checks catch most problems before publication:
- Compare distributions by source survey for every harmonized variable, before and after recoding.
- Cross-tabulate harmonized variables against stable demographic anchors (age, sex) to confirm the merge didn’t scramble something upstream.
- Where a benchmark exists, try to replicate a previously published result using your harmonized data as a sanity check.
Pro Tip: Run your distribution checks before AND after each major transformation step, not just at the end. A frequency table that looks fine after merging can mask an error that happened during recoding, and by then you’ve lost the ability to isolate which step introduced it.
Document every decision, even the ones that feel obvious at the time. Six months later, neither you nor your co-authors will remember why a category got collapsed a particular way, and a reviewer will ask.
When Should You Harmonize, Exclude, or Treat Data Separately?
Not every dataset earns a place in your harmonized file, and deciding that early saves weeks of wasted recoding.
- Confirm minimum metadata exists. You need, at minimum, a codebook or documented value labels, known fielding dates, and a sense of sampling design. If a source survey has none of these, harmonizing it is guesswork dressed up as data work.
- Apply your harmonize/exclude/treat-separately rule. Harmonize when metadata is complete and the concept match is close. Treat as a separate, non-pooled category when the concept is related but not equivalent (different response scale, different reference period). Exclude when sample compatibility is fundamentally broken, such as a convenience sample sitting next to a probability sample.
- Estimate effort by project complexity. A small project, a handful of variables across two waves of the same survey, might take a few days. A medium project with mixed modes (phone and web) adds real time for mode-effect checks. A large multi-country, multi-year harmonization is a months-long undertaking, not a sprint, and should be scoped that way from the proposal stage.
- Set your minimum reproducibility deliverables before you start, not after a reviewer asks. That means the harmonized dataset, the codebook, the transformation log, and a written statement of known limitations, ready to share alongside any publication or public data release.
Our step-by-step survey methodology guide walks through the upstream design choices that make these decisions easier the next time around.
When Does a Harmonization Project Need a Full-Service Partner?
Some harmonization projects are a weekend of scripting. Others involve a dozen countries, three languages, and hard-to-reach populations where the underlying sampling frames barely resemble each other. That’s when outsourcing stops being a luxury and starts being the only realistic path to an audit-ready dataset on deadline.
Veridata Insights supports harmonization work at exactly that level of complexity. Our services cover:
- Methodology consultation and questionnaire review before fielding, which is the cheapest point to prevent future harmonization headaches
- Survey programming and data collection across B2B, B2C, healthcare, and hard-to-reach audiences
- Data processing, coding, and cleaning built for downstream comparability
- Reporting, analytics, and data visualization once your harmonized dataset is ready to analyze
We work project by project with no minimums, seven days a week, because harmonization deadlines rarely respect a nine-to-five calendar. If your project spans multiple countries or populations that standard panels don’t reach, our research recruitment expertise becomes part of the harmonization solution, not an afterthought bolted on later.
How Do You Handle Missing and Special Values Across Surveys?
Missing data is rarely just “missing.” Most surveys distinguish between several flavors: don’t know, refused, not applicable, and system missing from skip logic. Treat these as distinct categories, not one blanket NA, because collapsing them erases information a reviewer or downstream analyst may need.
The core discipline is consistency. If one source survey codes “refused” as -9 and another uses 99, your target coding scheme needs one unified special-value code, documented in your codebook, with the mapping logged in your transformation file. Losing track of which special-value code came from which source is one of the fastest ways to introduce silent bias into a merged file.
Two practical rules keep this manageable. First, preserve missing-value type distinctions in your target coding scheme wherever the analysis might depend on them. Skip-logic “not applicable” behaves very differently in a regression than a genuine “don’t know,” and pooling them together can distort coefficient estimates in ways that are hard to trace back. Second, report missingness rates by source survey in your validation output. A harmonized variable with 2% missing in one source and 40% in another is a signal worth investigating before you trust any pooled analysis, not a footnote to mention after publication.

Special values tied to skip patterns need particular care during merging, since a respondent skipped out of a question in one survey may not have even seen the equivalent item in another. Document the skip logic alongside the harmonized variable itself, not in a separate methods appendix nobody cross-references.
What Ethical and Privacy Issues Come Up in Harmonization Work?
Merging datasets increases re-identification risk, even when each individual source file was properly anonymized. Combining demographic variables, geographic indicators, and survey wave information across multiple datasets can narrow a respondent pool enough that individuals become identifiable, a risk that grows with every additional source you add to the merge.
Consent scope is a real constraint, not a formality. A respondent who agreed to participate in a national health survey didn’t necessarily consent to their data being pooled into a multi-country comparative dataset. Before harmonizing across sources, confirm that the original consent language and any relevant data-use agreements permit the combined use you’re planning. When they don’t clearly permit it, that’s a conversation with an ethics board or data provider, not a judgment call to make alone at the analysis stage.
Data minimization applies to harmonized outputs the same way it applies to raw collection. Include only the variables and identifiers the harmonized dataset actually needs for its stated research purpose, and strip or aggregate geographic and demographic detail beyond what the analysis requires. Following the AAPOR best practices on lifecycle transparency also serves an ethical function here: documenting exactly how data was combined and weighted gives downstream users, and any oversight body reviewing the project, the information needed to assess whether the harmonized dataset is being used appropriately.
How Do You Reconcile Different Sampling Frames and Survey Designs?
Cross-survey differences in sampling frame are often the hardest heterogeneity to fix, because unlike a mismatched response scale, you can’t recode your way out of a fundamentally different sample structure. A probability sample from a national statistics office and an opt-in online panel are not interchangeable, no matter how similar their questionnaires look on paper.
Start by documenting each source survey’s design explicitly: sampling frame, stratification, clustering, and mode (phone, web, in-person). The ex-post harmonization literature is explicit that these methodological differences need to be modeled, not assumed away, because pooling data from different modes or frames without adjustment can introduce mode effects that masquerade as substantive findings.
Weight harmonization is usually the most technical piece of this work. Design weights from different surveys typically aren’t directly comparable, and combining them without rescaling can badly distort pooled estimates, over-representing whichever source survey had a larger or more heavily weighted sample. Where possible, rescale weights to a common metric, or run analyses with and without weighting to check whether conclusions are weight-sensitive. Where sampling frames diverge too sharply to reconcile through weighting alone, treat the surveys as separate populations for reporting purposes rather than force a pooled estimate that quietly misrepresents both. Our survey and sampling guide covers the design fundamentals worth understanding before you attempt any cross-survey pooling.
How Do You Harmonize Longitudinal Survey Data Over Time?
Longitudinal harmonization adds a dimension that cross-sectional harmonization doesn’t have to deal with: the same variable can drift in meaning across waves even within a single survey series, let alone across country panels.
Question wording changes between waves are the first thing to check, and they happen more often than most researchers assume. A “life satisfaction” item that shifted from a four-point to a seven-point scale between 2015 and 2022 needs the same rescaling treatment you’d apply across two entirely different surveys. Track every wording and scale change in a wave-by-wave changelog, not just in the codebook for the most recent wave.
Response category changes are the second trap. A category added or dropped between waves can shift the distribution of a variable in ways that look like real substantive change but are actually a measurement artifact. Before treating a shift across waves as a finding, rule out an instrument change as the cause.
Attrition and panel refreshment complicate the picture further. If a panel study replaces dropped respondents with fresh recruits partway through, your harmonized longitudinal file needs a flag distinguishing original panel members from refreshment samples, since pooling them without that distinction can bias trend estimates. Build your transformation log to capture wave-specific decisions the same way you would source-specific decisions in a cross-national project, because six months from now you’ll need to explain a wave-three anomaly just as much as a country-level one.
Get Hands-On Support for Your Next Harmonization Project
Scripting your own pipeline works fine until your project spans six countries, three languages, and a hard-to-reach patient population that standard panels can’t touch. That’s the point where Veridata Insights becomes the faster path, not a replacement for good methodology, but full-service execution behind it. We handle questionnaire review, programming, data collection, coding, and reporting for exactly the kind of multi-source projects this guide describes, with no project minimums and availability seven days a week.
If you’re scoping a cross-national or longitudinal study and want a partner who understands harmonization requirements before the first interview is fielded, start with our quantitative data gathering best practices for a sense of how we structure projects, then reach out through our contact page to scope your specific harmonization needs. For teams comparing broader audience research methods alongside harmonization work, Popjam is a useful complementary read.
Sources
- Survey harmonization (retroharmonize)
- retroharmonize vignette
- Ex-post harmonization of cross-national survey data: advances in methodological and substantive inquiries
- AAPOR best practices
- ReproSchema ecosystem (ScienceDirect)