TL;DR:
- Quantitative questionnaires gather countable data through fixed-response questions suitable for statistical analysis.
- Designing the instrument with a clear analytical goal and locking it after piloting ensures reliable, comparable results across waves.
Quantitative questionnaires are research instruments composed of fixed-response closed-ended questions designed to capture measurable numerical data suitable for statistical analysis. Unlike open-ended surveys, they produce countable outputs that researchers can average, compare, and test across large samples. The result is a structured data collection method that supports repeatable, defensible conclusions. When designed well, these instruments are among the most reliable quantitative research tools available to researchers and professionals across every field.
What are the essential design principles for quantitative questionnaires?

Survey design architecture controls whether your data can answer your research questions. Question wording controls collection quality, but architecture determines whether the whole instrument holds together. Architecture includes your design type, participant identifiers, wave plans, and analysis workflow. Get the architecture wrong, and even perfectly worded questions produce unusable data.
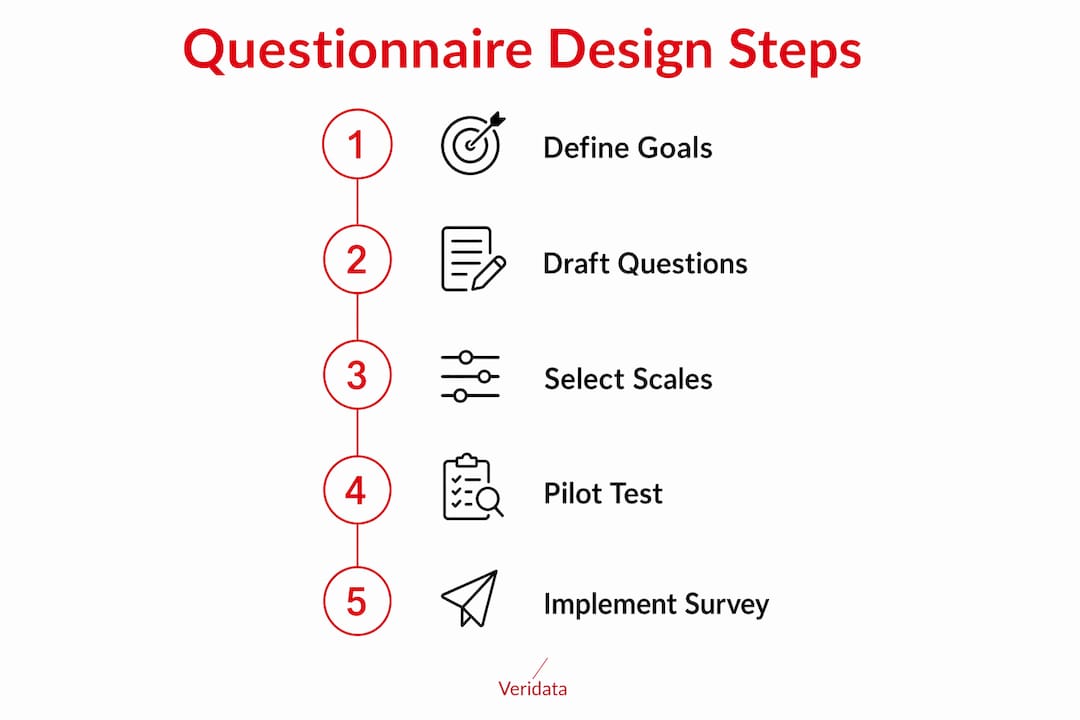
The questionnaire development process follows a seven-step sequence:
- Define the analytical question. Decide what claim or decision the data must support before writing a single question. Skipping this step is the primary cause of research failure in survey design.
- Select the survey design type. Choose cross-sectional, longitudinal, or panel design based on your research objective.
- Draft questions. Write closed-ended items that map directly to each analytical goal.
- Assign persistent participant IDs. Assign a unique identifier at first contact. Email addresses change; a persistent contact ID does not.
- Build codeable prompts. Structure every question so responses translate cleanly into a data field.
- Run a pilot test. Test with a small representative sample before full launch to catch ambiguous wording and logic errors.
- Define the analysis workflow. Map each question to a specific analysis method before data collection begins.
Pro Tip: Lock your analysis plan before you draft questions. If you cannot describe exactly how you will analyze a question’s output, the question is not ready to include.
The most overlooked step is the first one. Researchers often draft questions based on what feels relevant, then struggle to connect the data to a clear finding. Defining your analytical question first forces every item to earn its place in the instrument.
Which question types work best in structured surveys?
The measurement match framework guides question type selection by aligning format to what is being measured. Choosing the wrong format produces data that looks clean but answers the wrong question. As one research methodology principle puts it, “numbers are not automatically useful.” The question type must match the measurement goal.
The main question formats used in structured survey questions are:
- Yes/No (dichotomous). Best for screening and eligibility. Example: “Have you purchased this product in the last 90 days?”
- Multiple choice. Best for category and segment identification. Respondents select one or more options from a fixed list.
- Likert scale. The most common format in closed-ended questionnaires. A five-point Likert scale measures agreement or frequency and is the recognized industry standard for attitude measurement.
- Rating scale. Best for satisfaction and quality measures. Typically a 1–10 or 1–5 range with labeled endpoints.
- Ranking questions. Best for priorities and trade-offs. Respondents order a list of items by preference or importance.
- Numeric input. Captures counts, frequencies, or dollar amounts. Example: “How many times per week do you use this service?”
- Matrix questions. Combine multiple related items under one scale. Efficient for measuring several attributes with the same response format.
The table below shows when to use each format and what it measures best.
| Question type | Best used for | Output type |
|---|---|---|
| Yes/No | Screening, eligibility | Binary |
| Multiple choice | Segmentation, category | Nominal |
| Likert scale | Attitudes, agreement | Ordinal |
| Rating scale | Satisfaction, quality | Ordinal/interval |
| Ranking | Priorities, trade-offs | Ordinal |
| Numeric input | Counts, frequencies | Ratio |
| Matrix | Multiple related attributes | Ordinal |
One practical note on Likert data: Likert scale intervals are ordinal. Report median and mode for single items. Composite scores built from multiple Likert items may be treated as interval data, but always include distribution visuals alongside summary statistics.
How do you protect data quality and comparability across waves?
Data quality in statistical analysis surveys depends less on individual question quality and more on consistency across the full instrument. The most damaging error researchers make is adjusting scale points, anchor labels, or question wording between survey waves. Locking scale point counts, anchor labels, and wording from wave one onward is mandatory to maintain measurement invariance in longitudinal designs. Any change breaks comparability and forces you to treat the new wave as a separate study.
Common threats to data quality include:
- Scale drift. Changing a five-point scale to a seven-point scale mid-study invalidates trend comparisons.
- Anchor mismatch. Using “Agree/Disagree” anchors for a frequency question produces unreliable data.
- Central tendency bias. Respondents cluster at the midpoint when scale anchors are vague or the topic feels sensitive.
- Acquiescence bias. Respondents agree with statements regardless of content. Reverse-coded items catch this.
- Ceiling effects. When most respondents score at the top of a scale, the instrument cannot detect meaningful differences.
Pro Tip: Pilot test every open-ended follow-up prompt with at least 10 respondents before launch. If more than two people interpret the question differently, rewrite it.
Adaptive and responsive survey designs allow real-time monitoring and mid-collection adjustments without compromising measurement integrity. This approach, documented in the SAGE Handbook of Survey Methodology, is increasingly standard in professional research environments. The key is adjusting operational elements, such as reminders and sampling weights, without touching the instrument itself.
Pairing closed-ended items with optional open-ended follow-ups also strengthens your data. Quantitative precision combined with qualitative context produces richer insight than either method alone. The follow-up prompt does not change the quantitative output; it adds the “why” behind the number.
What practical steps make quantitative questionnaire implementation effective?
Designing a sound instrument is only half the work. Implementing it well requires discipline at every stage of the research workflow. These steps apply whether you are running a single-wave study or a multi-cohort longitudinal program.
- Define your measurement goals first. Write one sentence describing the decision or claim each section of the questionnaire must support. If you cannot write that sentence, the section is not ready.
- Apply the measurement match framework. For each construct, select the question type that produces the right output. Use yes/no for eligibility, Likert for attitudes, and numeric input for behavioral frequencies.
- Assign persistent unique identifiers. Using persistent participant IDs from initial contact is the only reliable method for merging data across waves. Email addresses change; a stable contact ID does not.
- Add optional qualitative follow-ups. Place one open-ended prompt after key rating or Likert items. Keep it optional to protect response rates. This gives analysts the context to interpret outliers without contaminating the quantitative data structure.
- Segment your analysis plan by respondent characteristics. Plan your cross-tabs before launch. Decide which demographic or behavioral variables will be used to break out results. If you need to segment by role, industry, or tenure, collect those variables in the instrument.
- Maintain instrument discipline across waves. Treat the questionnaire as a locked document after pilot testing. Changes require a formal review, not an ad hoc edit. Document every version with a date and rationale.
Following a step-by-step survey methodology reduces the risk of mid-study redesigns, which are costly and often fatal to longitudinal comparability. The goal is to make every decision before data collection begins, not during it.
For B2B researchers, the stakes are especially high. Respondent pools are smaller, and each wave of data carries more weight per respondent. Applying B2B survey design principles from the start protects both data quality and respondent relationships.
Key Takeaways
Effective quantitative questionnaire design requires locking your analysis plan, matching question types to measurement goals, and maintaining instrument consistency across every wave of data collection.
| Point | Details |
|---|---|
| Define analysis goals first | Write the analytical question before drafting any survey items to prevent unusable data. |
| Match question type to construct | Use the measurement match framework to select yes/no, Likert, rating, or numeric formats correctly. |
| Lock the instrument after piloting | Never change scale points, anchors, or wording between waves; any change breaks longitudinal comparability. |
| Use persistent participant IDs | Assign a stable contact ID at first contact; email addresses are unreliable for tracking across waves. |
| Combine quant with optional qual | Add optional open-ended follow-ups after key rating items to capture context without disrupting data structure. |
What I have learned from watching good surveys go wrong
Working across research projects in B2B, healthcare, and consumer sectors, I keep seeing the same pattern. Researchers draft questions first and define the analysis plan last. It feels productive to write questions early. The problem is that you end up with a 30-item instrument where only 12 questions actually connect to a decision. The other 18 are interesting but unanalyzable.
The second mistake I see constantly is scale drift. A team runs wave one with a five-point satisfaction scale. By wave three, someone has switched to a seven-point scale because “it gives more nuance.” Now you have three waves of data you cannot trend. The fix is simple: treat the instrument like a legal document after pilot testing. No changes without a formal review and a documented rationale.
The third thing I have learned is that persistent participant IDs are not a technical detail. They are a research integrity issue. I have seen longitudinal studies collapse because the team used email addresses as identifiers. People change jobs, change emails, and the merge fails. A stable ID assigned at first contact costs almost nothing to implement and saves enormous pain later.
The questionnaire design practices that hold up over time are not complicated. They are just disciplined. Define the analysis plan. Lock the instrument. Assign real IDs. Pilot thoroughly. That is the whole game.
How Veridata Insights supports your survey design work
Veridata Insights works with researchers and professionals across B2B, B2C, healthcare, and hard-to-reach audiences to build survey instruments that hold up under analysis. The team covers the full process: consultation and design, questionnaire review, programming, data collection, processing, and reporting. Whether you need a full-service research partner or a second set of eyes on your instrument before launch, Veridata Insights adapts to your scope with no project minimums. If you want expert questionnaire design support from a team that treats data quality as non-negotiable, reach out seven days a week, 365 days a year.
FAQ
What is a quantitative questionnaire?
A quantitative questionnaire is a research instrument that uses closed-ended questions to collect numerical data for statistical analysis. The primary output is countable, comparable data suitable for averaging and significance testing across samples.
How many questions should a quantitative questionnaire include?
There is no fixed rule, but every question must connect directly to a defined analytical goal. Instruments with items that cannot be mapped to a specific analysis decision should be shortened before launch.
What is the best scale for measuring attitudes in a survey?
The five-point Likert scale is the recognized standard for measuring agreement and frequency in closed-ended questionnaires. Likert items produce ordinal data, so report median and mode for individual items rather than means.
How do you maintain comparability across multiple survey waves?
Lock scale point counts, anchor labels, and question wording from wave one onward. Any change to the instrument between waves breaks measurement invariance and prevents valid trend analysis.
Why are persistent participant IDs important in longitudinal surveys?
Persistent unique identifiers allow accurate data merging across waves. Email addresses change and create merge failures; a stable contact ID assigned at first contact is the industry standard for longitudinal tracking.
Recommended
- Top questionnaire design tips to maximize research quality
- Survey Design Best Practices for Reliable Quantitative Data – Veridata Insights
- How to Design a Successful Quantitative Research Study – Veridata Insights
- “How Many Respondents Do I Need?” – A Practical, Evidence‑Based Answer for Research Clients – Veridata Insights