Key driver analysis quantifies which measured factors explain variation in a chosen outcome, like satisfaction or purchase intent, and ranks them by their share of explained variance. The output tells you where to spend your next research dollar and which fixes will actually move the metric leadership cares about.
- Outputs: importance percentages (or standardized coefficients) for each driver, plus model fit as R²
- What the numbers mean: a driver’s importance share reflects its statistical contribution to explaining the outcome, not proof that changing it will change behavior
- First action: cross-reference importance against current performance and prioritize drivers that score high on importance but low on performance
TL;DR:
- Ensure predictors are on the same scale and have sufficient sample size, generally 15 to 20 respondents per predictor, to produce stable importance estimates.
- Use Shapley Regression or Johnson’s Relative Weights instead of standard regression when predictors are highly correlated, to obtain reliable importance scores.
- Always report model fit statistics such as R², sample size, and confidence intervals alongside importance rankings to enable accurate interpretation.
- Validate top drivers with follow-up experiments like A/B tests, treating importance scores as hypotheses rather than conclusive causation.
- Build a priority map by plotting importance against current performance to identify which drivers require fixing, protecting, or reallocation of resources.
Table of Contents
- What Key Driver Analysis Measures and How to Read the Output
- When Should You Run a Key Driver Analysis?
- Getting Your Survey Data Ready for Driver Analysis
- Which Statistical Method Should You Use?
- Turning Importance Scores Into a Priority Map
- Where Key Driver Analysis Goes Wrong
- How Veridata Insights Applies Key Driver Analysis in Practice
- Where Veridatainsights Fits in Your Next Driver Study
- Key Takeaways
- Sources
What Key Driver Analysis Measures and How to Read the Output
Key driver analysis (KDA), sometimes called driver analysis, importance analysis, or key factors analysis, uses regression-based methods to answer one question: out of everything you measured, what actually moves the outcome? The outcome is typically a single rated metric like satisfaction, Net Promoter Score, or renewal intent, and the predictors are the attribute ratings you collected alongside it.
Most reports lean on standardized beta weights first, because they let you compare predictors measured on different scales. A standardized coefficient tells you the relative pull of one variable holding others constant, but it can swing wildly when two drivers are highly correlated, which is exactly why raw betas rarely make the final client slide.
Two quick examples show how this plays out:
- NPS study: “Ease of use” carries 28% importance with a mean rating of 6.2 out of 10, flagging it as underperforming relative to its weight.
- Renewal intent study: “Price fairness” carries 12% importance but scores well, so it needs protecting, not fixing.
When Should You Run a Key Driver Analysis?
KDA fits best when you already have a clear outcome metric and a defined list of candidate drivers rated on a consistent scale. Run it under these conditions:
- You’re measuring satisfaction, NPS, repurchase intent, or product choice intent and want to know which rated attributes explain the score.
- You have quantitative ratings for every driver, not open-ended feedback, and the outcome and predictors were collected on the same scale format.
- Your sample size supports stable estimates relative to the number of predictors in the model, typically several dozen respondents per predictor at minimum.
Skip KDA when you’re still in exploratory mode and don’t yet know which attributes matter, when your sample is too thin to trust the coefficients, or when you suspect a major driver wasn’t asked about at all. Running regression on an incomplete driver list just produces a confident answer to the wrong question.
Getting Your Survey Data Ready for Driver Analysis
Bad inputs produce importance rankings that look authoritative and mean nothing. Before you run any model, lock down these design choices.
- Match your scales. Keep the outcome and every predictor on the same rating format; a mix of 5-point and 10-point scales, or Likert and semantic differential items, distorts the regression and needs correcting before modeling. Convert everything to percent-of-max or z-scores if you can’t standardize collection.
- Size your sample to your predictor count. A common rule of thumb calls for roughly 15 to 20 respondents per predictor as a floor; thinner samples produce importance estimates that shift dramatically if you rerun the study next quarter.
- Handle categorical predictors deliberately. Dummy-code nominal variables, and switch to logistic regression when your outcome is binary, like “renewed” versus “churned,” rather than forcing a continuous-outcome model onto yes/no data.
- Choose a missing-data strategy before you see the data. Listwise deletion is simplest but wastes cases; pairwise deletion keeps more data but can produce an inconsistent correlation matrix; multiple imputation is more defensible when missingness is nontrivial.
- Run your pre-checks. Build a correlation matrix and calculate the Variance Inflation Factor for every predictor. VIF values above roughly 5 signal a multicollinearity problem serious enough to destabilize your coefficients.
Pro Tip: Run the VIF check before you touch the outcome variable at all. If two attributes are pulling VIFs above 5 against each other, you likely need to combine them into a single construct rather than force a regression to sort out which one “wins.”
Which Statistical Method Should You Use?
Multiple linear regression is the default starting point for most driver analysis surveys, and its beta weights are easy to explain to a client in one sentence. Its weakness shows up the moment predictors correlate: betas become unstable, sometimes flipping sign entirely when you add or remove a single variable, and that instability is precisely what multicollinearity checks are designed to catch.
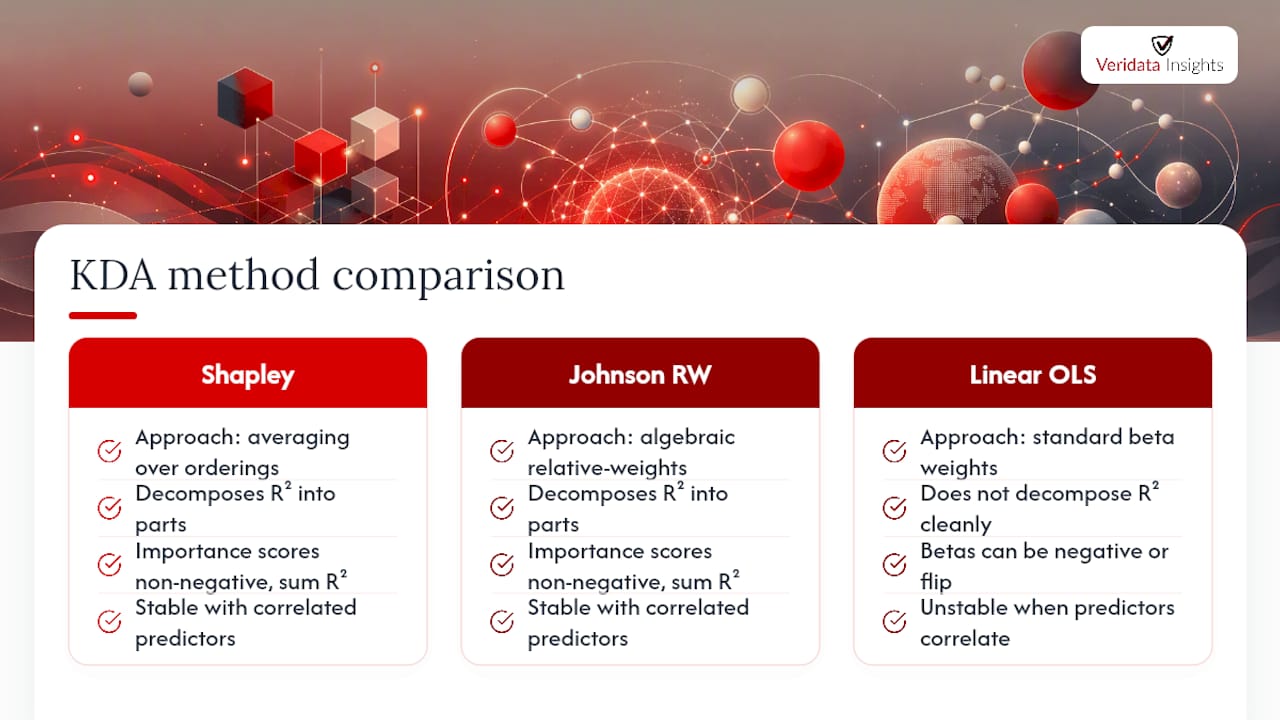
This is why Shapley Regression and Johnson’s Relative Weights have become the preferred approach whenever predictors overlap, which in survey data is nearly always. Both methods decompose R² into non-negative importance scores that sum cleanly to the model’s total explained variance, and both remain stable even when correlated attributes would send a standard regression sideways. Shapley’s Averaging Over Orderings approach and Johnson’s algebraic relative-weights method arrive at nearly identical answers in practice, and both are considered the standard when driver overlap is heavy.
For binary outcomes, standard OLS regression is the wrong tool. Use logistic regression or another generalized linear model, then interpret derived importance through pseudo-R² decomposition rather than the R² used for continuous outcomes.
On tooling: R’s relaimpo package (LMG method) handles relative-weights decomposition natively, Python libraries can implement Shapley-based approaches for teams building scripted pipelines, and point-and-click platforms like JASP or jamovi make regression-based KDA accessible without a coding step. Move to Shapley or relative weights as soon as your correlation matrix or VIF check flags meaningful overlap; there’s no advantage to sticking with plain regression once that threshold is crossed.
A model’s R² and sample size belong in every executive summary alongside the importance rankings. A driver ranking without its fit statistic is a ranking nobody can sanity-check.
Turning Importance Scores Into a Priority Map
Raw importance percentages tell you what matters statistically, but they don’t tell you what needs fixing. That’s what an importance-performance matrix, or IPA, is for.
- Plot derived importance on the vertical axis and current performance, either the mean rating or a top-box percentage, on the horizontal axis.
- Set your threshold lines. Use the sample mean for each axis if your driver set is broad, or a fixed midpoint (like the scale’s center point) if you want a stricter, more absolute standard.
- Read the four quadrants. High importance, low performance is your Fix quadrant and gets resourced first. High importance, high performance is Maintain, protect it. Low importance, low performance is Low Gain, defer it. Low importance, high performance is Over-invest, a candidate for reallocating budget elsewhere.
- Translate priority quadrant items into a testable hypothesis rather than an immediate rollout. Converting derived importance into this quadrant map gives stakeholders a visual, defensible case for where budget goes next, which communicates far better than a table of coefficients ever will.
Where Key Driver Analysis Goes Wrong
The single most common misread of KDA output is treating importance as causation. Correlation-based importance from Kicue’s guide should be reported alongside plans for follow-up testing, A/B tests, pilot programs, or natural experiments that confirm the relationship actually holds when you intervene.
Before you trust any ranking, check its stability. Bootstrap the importance estimates or cross-validate against a holdout sample, and see whether the top three drivers hold their rank when you swap in a slightly different predictor set. Every executive summary should carry VIF results, R², confidence intervals, and sample size, not just the ranked list.
- Assign an owner to each priority driver before the meeting ends
- Define a measurable pilot metric tied to that driver, not a vague “improve experience” goal
- Set a review date to measure whether the pilot moved the actual outcome, not just the driver rating
Pro Tip: Treat your top three drivers as hypotheses, not conclusions, until a pilot test confirms the relationship. Regression tells you where to look; a small experiment tells you if you were right.
How Veridata Insights Applies Key Driver Analysis in Practice
Veridata Insights runs full-service studies from questionnaire design through data visualization, which matters for KDA specifically because bad inputs at the design stage can’t be fixed later at the regression stage. Our team reviews scale consistency and sample-size targets before programming ever starts.
- Questionnaire review catches mixed-scale problems before they become multicollinearity headaches
- Programming and data collection standardize rating formats across every driver, not just the headline outcome
- Reporting and visualization translate importance-performance output into quadrant maps a business team can act on
We recruit hard-to-reach and specialized audiences, including B2B and healthcare panels, and that recruiting discipline matters more for driver analysis than most people realize. A driver ranking built on a skewed or convenience sample won’t replicate, no matter how clean the regression looks. Our case study on locating hard-to-reach audiences shows how recruitment quality feeds directly into analysis you can actually trust.
Where Veridatainsights Fits in Your Next Driver Study
Running a defensible key driver analysis takes more than access to a stats package. It takes clean scale design at the questionnaire stage, a sample sized correctly for your predictor count, and a firm that knows to run VIF checks before anyone touches a regression output. That’s the gap Veridatainsights closes for research teams who don’t have an in-house methodologist for every project.
We handle the full pipeline: consultation, questionnaire review, programming, data collection, coding, and the reporting and visualization that turns Shapley-based importance scores into an importance-performance matrix your stakeholders can actually use. Our guidance on designing B2B surveys that work and our broader client survey framework both feed directly into getting the scale-consistency step right, the single most common point where driver studies go wrong before analysis even begins.
If you’re planning a satisfaction, NPS, or renewal-intent study and want the driver analysis built correctly from the first questionnaire draft, contact Veridata Insights to scope your project. No minimums, and we work with B2B, B2C, and healthcare audiences seven days a week.
Key Takeaways
Key driver analysis works because it converts correlated survey ratings into stable, non-negative importance scores that stakeholders can prioritize against actual performance data.
| Point | Details |
|---|---|
| Check for multicollinearity first | Run a correlation matrix and VIF on every predictor before trusting any regression output. |
| Prefer Shapley or relative weights | Use these methods over plain regression whenever predictors overlap, which is nearly always. |
| Report fit alongside rankings | Include R², sample size, and confidence intervals with every importance ranking you present. |
| Build the priority map | Plot importance against performance to route Fix, Maintain, Low Gain, and Over-invest quadrants. |
| Validate before acting | Confirm top drivers with pilot tests or A/B experiments; derived importance is correlation, not proof. |
| Get the inputs right from the start | Veridata Insights reviews scale consistency and sample design during questionnaire programming, before any driver analysis begins. |