Incidence rate (IR) is the percentage of screened respondents who qualify for your study, calculated as: IR = qualified respondents ÷ total respondents screened × 100. Screen a panel of people, and if 10% qualify, your IR is the proportion of qualified respondents compared to total screened. That single number drives everything downstream: how many people you need to approach, how long fieldwork will run, and what it will cost per complete.
- IR tells you the screening burden before you commit to a sample size
- A 10% IR means you screen 10 people for every 1 complete
- Lower IR = more screening contacts, longer timelines, higher cost per complete
- Calculating IR early in study design is the single most effective way to catch feasibility problems before they become budget problems
Table of Contents
- What incidence rate measures and why it matters for feasibility
- How to calculate incidence rate: formulas and variants
- Worked examples: B2C, B2B, and a low-incidence healthcare study
- How IR shapes sample size, timeline, and cost
- Why is your incidence rate lower than expected?
- Practical tactics to raise or manage low IR
- Reporting IR transparently in your methods section
- What counts as a typical IR? Benchmarks by audience type
- When to bring in a full-service research firm for low-IR studies
- Key Takeaways
- Veridata Insights handles the studies other firms find too hard
- Useful sources and further reading
What incidence rate measures and why it matters for feasibility
Incidence rate is the proportion of a population that meets your study’s eligibility criteria during a defined screening window. It is not the same as prevalence. Prevalence is a snapshot: the total number of existing cases at a point in time or over a period. Incidence, by contrast, measures qualifying occurrences within the screening window you define for your study. For a market researcher, that distinction is methodologically critical: you are not measuring how many people in the U.S. own a product, you are measuring how many people in your recruited pool qualify to talk about it right now.
The practical impacts of IR on study feasibility are direct:
- Approach size: The lower the IR, the more contacts you need to reach your complete target
- Cost per complete: Screening costs accumulate whether a respondent qualifies or not; low IR inflates cost per complete fast
- Field timeline: Fewer qualifiers per day means more days in field to hit your quota
- Panel strain: Repeatedly screening the same panel members for a low-IR study erodes response quality over time
Pro Tip: Run a soft launch of 50–100 screening contacts before committing to full fieldwork. A pilot check on your assumed IR can save you from buying three times the sample you actually need.
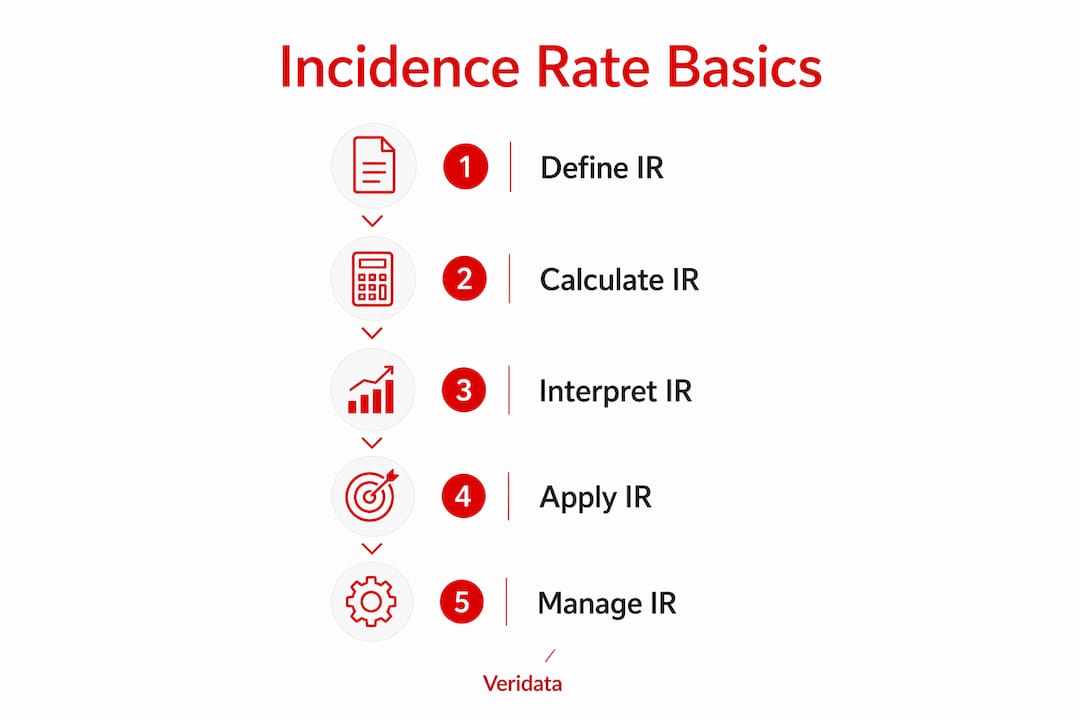
How to calculate incidence rate: formulas and variants
The canonical formula is straightforward. What trips researchers up is choosing the right numerator and denominator, especially when screeners are staged or when partial completes exist.
Core formula:
IR (%) = (Qualified Respondents ÷ Total Respondents Screened) × 100
The numerator is the count of respondents who passed all eligibility criteria. The denominator is everyone who entered the screener, regardless of how far they got. When you use multi-stage screening), the denominator must still reflect the total who entered stage one, not just those who cleared an earlier gate. Mixing denominators across stages is one of the most common IR calculation errors in practice.
Screening ratio is the inverse: how many contacts you need per complete. If IR = 20%, the screening ratio is 5:1 (screen 5 to get 1 complete).
For very rare targets, per-1,000 or per-100,000 scaling makes the rate easier to communicate to stakeholders without losing precision.
| Formula Variant | Formula | When to Use |
|---|---|---|
| Basic IR (%) | Qualified ÷ Screened × 100 | Standard consumer and B2B studies |
| Screening ratio | Screened ÷ Qualified | Planning approach size and cost |
| IR per 1,000 | (Qualified ÷ Screened) × 1,000 | Niche B2B or specialty audiences |
| IR per 100,000 | (Qualified ÷ Screened) × 100,000 | Rare disease or ultra-low-incidence healthcare |
| Multi-stage IR | Stage 1 qualifiers ÷ Total entered stage 1 × 100 | Staged screeners; use stage-1 denominator throughout |
Keep your numerator and denominator definitions consistent across all stages and all reporting. Switching definitions mid-study produces IR figures that cannot be compared or reproduced.
Worked examples: B2C, B2B, and a low-incidence healthcare study
These three examples walk through the math step by step. Mirror the structure for your own studies.

B2C example: recent fast-food visitors
Assumptions: Target = adults who visited a quick-service restaurant in the past 7 days. General consumer panel. Complete target = 400.
- Screen 1,000 respondents
- 420 report a qualifying visit
- IR = 420 ÷ 1,000 × 100 = the qualifying percentage.
- Screening ratio is the number of people screened per qualified respondent, approximately 2.4 to 1 in this example.
- To reach the required completes, divide the target number by the IR as a decimal to find how many contacts must be approached.
An IR around this level is generally considered comfortable for fieldwork. Fieldwork is fast, screening costs are low, and a standard online panel handles it easily.
B2B example: IT decision-makers at mid-market firms
Assumptions: Target = IT directors or above at companies with 100–999 employees who evaluated cybersecurity software in the past 6 months. Complete target = 100.
- Screen 800 business professionals
- 40 meet all three criteria
- IR = 40 ÷ 800 × 100 = the qualifying percentage.
- Screening ratio equals total screened divided by qualified, resulting in a ratio of 20:1 in this case.
- The contacts needed equals the desired completes divided by the IR expressed as a decimal.
That 20:1 ratio means you are paying screening costs for 1,900 people who will not complete the survey. Recruiting hard-to-reach B2B audiences at this IR typically requires targeted list sourcing or professional recruitment, not a general panel.
Healthcare/low-incidence example: rare condition patients
Assumptions: Target = adults diagnosed with a specific rare autoimmune condition currently on a biologic therapy. Complete target = 50.
- Screen 5,000 contacts across multiple recruitment channels
- 25 qualify
- IR = 25 ÷ 5,000 × 100 = the percentage of qualified respondents.
- Screening ratio is the number of people screened per qualified respondent, about 200:1 in this example.
- The number of contacts needed is calculated by dividing the target completes by the decimal IR.
At 0.5% IR, a standard panel is not viable. You need specialist databases, patient advocacy partnerships, or physician referral networks. Feasibility review is mandatory before fieldwork begins.
How IR shapes sample size, timeline, and cost
Once you know your IR, translating it into study planning variables is arithmetic. The formula for required approach size is:
The table below shows how dramatically approach size and screening burden shift as IR drops, using a fixed target of 200 completes.
| IR | Approach Size Needed | Screening Ratio | Relative Cost Pressure |
|---|---|---|---|
| 50% | 400 | 2:1 | Low |
| 10% | — | 10:1 | Moderate |
| 2% | — | 50:1 | High |
| 0.5% | 100,000 | 500:1 | Specialist recruitment required |
For field timeline, divide your daily screening capacity by the screening ratio to get daily qualifiers. If a panel delivers 500 screener completes per day and your IR is 10%, you get roughly 50 qualifiers per day. At 200 completes, that is about 4 field days under ideal conditions. Drop IR to 2% and the same panel delivers only 10 qualifiers per day, stretching fieldwork to 20 days or more.

Cost sensitivity works the same way. If your screening cost is fixed per contact, a drop from 10% IR to 2% IR multiplies your screening spend fivefold for the same number of completes. The cost approach to budgeting a study must account for this multiplier explicitly. Researchers who budget only for completes, not for screening contacts, routinely underestimate project costs when IR is lower than assumed. Knowing your respondent count needs before fieldwork starts is the cleaner path.
Why is your incidence rate lower than expected?
Low IR is rarely random. Most causes fall into a short list of diagnosable problems. Work through this checklist before redesigning your study.
Common causes:
- Overly narrow eligibility criteria: Stacking too many qualifying conditions (recency + behavior + demographics + brand usage) compounds exclusions multiplicatively
- Screener wording problems: Ambiguous or leading questions cause misrouting; respondents who should qualify get screened out, and vice versa
- Sampling frame mismatch: Your panel or list does not reflect the population where your target actually lives; a general consumer panel will underperform for niche B2B or clinical targets
- Timing effects: Seasonal behavior, recent news events, or product launch timing can shift qualifying rates significantly from your baseline assumption
- Mode limitations: A phone screener reaches a different demographic slice than an online panel; IR can differ by 10–20 percentage points across modes for the same criteria
- Respondent fatigue and speeding: Panel members who rush through screeners give unreliable answers, inflating apparent disqualifications
Diagnostic checklist:
- Review the sampling source: does it match your target population profile?
- Audit screener logic: are routing rules sending qualified respondents to a disqualify screen by mistake?
- Check question wording: are eligibility questions unambiguous and free of leading language? Screener design is often the fastest fix
- Compare pilot IR to assumed IR: a gap of more than 5 percentage points warrants a screener revision before scaling
- Look for soft screener leakage: are respondents who should not qualify slipping through because a question is too easy to answer favorably?
- Verify your numerator: are partial completes or misrouted records inflating or deflating your qualified count?
Practical tactics to raise or manage low IR
Improving IR is not about lowering your standards. It is about removing friction between your eligibility criteria and the people who genuinely meet them.
Operational tactics:
- Broaden eligibility where defensible: Review each criterion and ask whether it is truly necessary for the research objective. Removing one unnecessary qualifier can double IR
- Shorten and sharpen the screener: Long screeners increase dropout before qualification; every unnecessary question is a leak in your funnel
- Use targeted sampling frames: For B2B or healthcare studies, a verified specialty list or database outperforms a general panel by a wide margin. Custom recruitment is often the right call when IR drops below 5%
- Test multiple recruitment modes: Email, phone, social targeting, and in-person intercepts reach different population slices; blending modes often lifts overall IR
- Increase incentives strategically: Higher incentives improve response rates among hard-to-reach groups, but the gain is usually in completion rate, not in qualification rate. Do not expect incentives alone to fix a sampling frame problem
- Use premium profiling: Some panel providers offer pre-profiled respondents matched to your criteria before the screener runs, effectively pre-filtering the denominator
Ethical guardrails matter here. Never soften eligibility criteria to the point where unqualified respondents complete the survey. Never use leading screener questions to push respondents toward qualification. Both practices corrupt your data and undermine the validity of your findings.
Pro Tip: For studies with IR below 10%, consider staged quotas: recruit a small first wave, verify the real-world IR, then scale the second wave with corrected approach-size estimates. A step-by-step recruitment process built around staged quotas prevents the costly surprise of a 2% IR discovered at full scale.
Reporting IR transparently in your methods section
Reproducibility starts with how you document your incidence calculation. Reviewers, clients, and future researchers need enough detail to reconstruct your IR from scratch.
Reporting template (methods section):
Transparency best practices:
- Report the exact numerator and denominator, not just the percentage
- Describe all screener routing logic, including any multi-stage gates
- Specify how partial completes were handled (excluded, included, counted separately)
- Note whether IR was measured at soft launch, at full field, or both
- Disclose any changes to eligibility criteria made after pilot results
- If IR differed across recruitment modes or waves, report each separately
- Include the screener instrument in an appendix so reviewers can assess wording effects
Transparent denominator reporting is the standard that separates defensible methods from ones that cannot survive peer review. Clients increasingly expect this level of disclosure in deliverables, and it protects you when results are questioned.
Peer review and client reporting checklist:
- Numerator and denominator explicitly stated
- Eligibility criteria listed verbatim
- Screener routing described or appended
- Partial complete handling documented
- Any IR revisions between pilot and full field noted
- Mode-specific IR reported if blended recruitment was used
What counts as a typical IR? Benchmarks by audience type
There is no universal “good” IR. Context determines whether a given rate is healthy or a red flag. A 15% IR in a healthcare study targeting a specific patient population is excellent; a 15% IR in a general consumer study about grocery shopping is a warning sign that your criteria may be too narrow.
| Audience Type | Typical IR Range | Notes |
|---|---|---|
| General consumer (broad behavior) | 40% | Standard online panels; wide eligibility |
| Consumer (specific product/brand users) | 15%–40% | Narrows with recency and brand requirements |
| Niche consumer (hobbyists, enthusiasts) | 5%–20% | Panel targeting helps; consider custom outreach |
| B2B (general business decision-makers) | 10%–25% | Varies widely by job function and company size |
| B2B (narrow title/industry/behavior) | 2%–10% | Specialty lists or professional networks needed |
| Healthcare (general patient population) | 5%–20% | Depends on condition prevalence in the U.S. |
| Healthcare (rare condition or treatment) | 0.5%–2% | Specialist recruitment mandatory |
Decision thresholds to apply:
- IR below 5%: trigger a formal feasibility review before committing to full fieldwork
- IR below 1%: standard panels are not viable; specialist recruitment, patient registries, or custom outreach required
- IR below 0.5%: budget and timeline assumptions need to be rebuilt from scratch; consider whether the study design itself needs revision
A single universal cutoff is misleading because the same IR means something very different depending on the audience, the panel source, and the screener complexity. Always interpret IR in context.
When to bring in a full-service research firm for low-IR studies
Some IR challenges are solvable with better screener design or a different panel. Others require infrastructure you cannot build project by project. The triggers for outsourcing are fairly clear:
- IR is below 5% and your current panel cannot deliver the approach size within your timeline
- The target audience requires verified professional credentials, clinical diagnosis, or behavioral profiling that a general panel cannot confirm
- You need multi-mode recruitment (phone, online, in-person, social) coordinated across a single study
- Your timeline is tight and you cannot absorb the risk of discovering a lower-than-expected IR at full scale
- The study involves healthcare, pharmaceutical, or clinical populations where recruitment compliance and data integrity requirements are strict
Veridata Insights specializes in exactly these situations. The firm’s services cover methodology consultation, targeted B2B and healthcare recruitment, custom panel sourcing and outreach, screener review, multi-mode data collection, and full data processing through to reporting. For low-IR projects, Veridata Insights can run a feasibility assessment before fieldwork begins, so you know your real approach size and cost before committing budget.
Working with a specialist partner on a hard-to-reach study means you get recruitment quality that a general panel simply cannot match, along with the methodology documentation needed to defend your findings to clients or reviewers.
Key Takeaways
Incidence rate is the single most important feasibility variable in study design: calculate it early, verify it with a pilot, and let it drive your approach-size and budget estimates.
| Point | Details |
|---|---|
| Calculate IR before budgeting | IR = qualified ÷ screened × 100; run this before committing to sample size or cost estimates. |
| Pilot test your assumed IR | A soft launch of 50–100 screener contacts reveals real-world IR and prevents costly full-field surprises. |
| IR below 5% triggers review | Below 5%, standard panels often cannot deliver; formal feasibility review and specialist recruitment are warranted. |
| Report numerator and denominator | Transparent IR reporting requires stating both figures, screener logic, and how partial completes were handled. |
| Veridata Insights for low-IR studies | Veridata Insights provides targeted recruitment, feasibility assessments, and multi-mode data collection for hard-to-reach and low-IR audiences. |
Veridata Insights handles the studies other firms find too hard
When IR drops below 5%, the project stops being a panel exercise and becomes a recruitment challenge. Veridata Insights is built for that. We provide feasibility assessments, targeted B2B and healthcare recruitment, screener review, and full-service data collection for studies where a general panel simply will not get you there. No project minimums, no rigid contracts, and we work 7 days a week. If you have a low-IR study on your desk right now and you are not sure whether your approach size or budget assumptions are realistic, request a feasibility review and we will tell you exactly what it will take.
Useful sources and further reading
The sources below back the methodology and formulas in this article. For calculation methods and epidemiological context, the NCBI StatPearls entries are the most rigorous starting point. For market-research practice, Quirk’s, Drive Research, and the Greenbook provide the most practitioner-relevant guidance.
- Incidence Rate in Market Research: How to Calculate and Use It — Clickworker; covers the canonical formula and worked examples
- What Is Incidence? Quirk’s Glossary of Marketing Research Terms — Quirk’s; definition, feasibility context, and pilot-launch guidance
- Incidence Rate (Market Research) — Wikipedia) — useful for screening ratio variants and denominator definitions
- Prevalence — StatPearls, NCBI Bookshelf — authoritative source for the incidence vs. prevalence distinction
- Incidence — StatPearls, NCBI Bookshelf — covers per-1,000 and per-100,000 scaling and epidemiological context
- What Is Incidence Rate (IR) in Market Research? — Drive Research — practical diagnostics for low IR and sampling frame issues
- Prevalence Rate Analysis Calculator — MetricGate — transparency and denominator reporting standards
- Understanding the Basics of Incidence — Greenbook.org — practitioner-focused overview of IR in U.S. market research
- Effect Measures in Prevalence Studies — PMC/NCBI — academic reference for prevalence odds ratios and incidence rate ratio estimation
This article is general methodological guidance, not a substitute for professional consultation on your specific study design. Confirm approach sizes, feasibility thresholds, and recruitment requirements with a qualified research partner for your own project.