Deduping survey data means finding exact and near-duplicate records and deciding, with evidence, whether to flag them, weight them, or remove them. The first move is always detection, not deletion: run a percent-match check and inspect the suspicious tail before you touch a single row.
TL;DR:
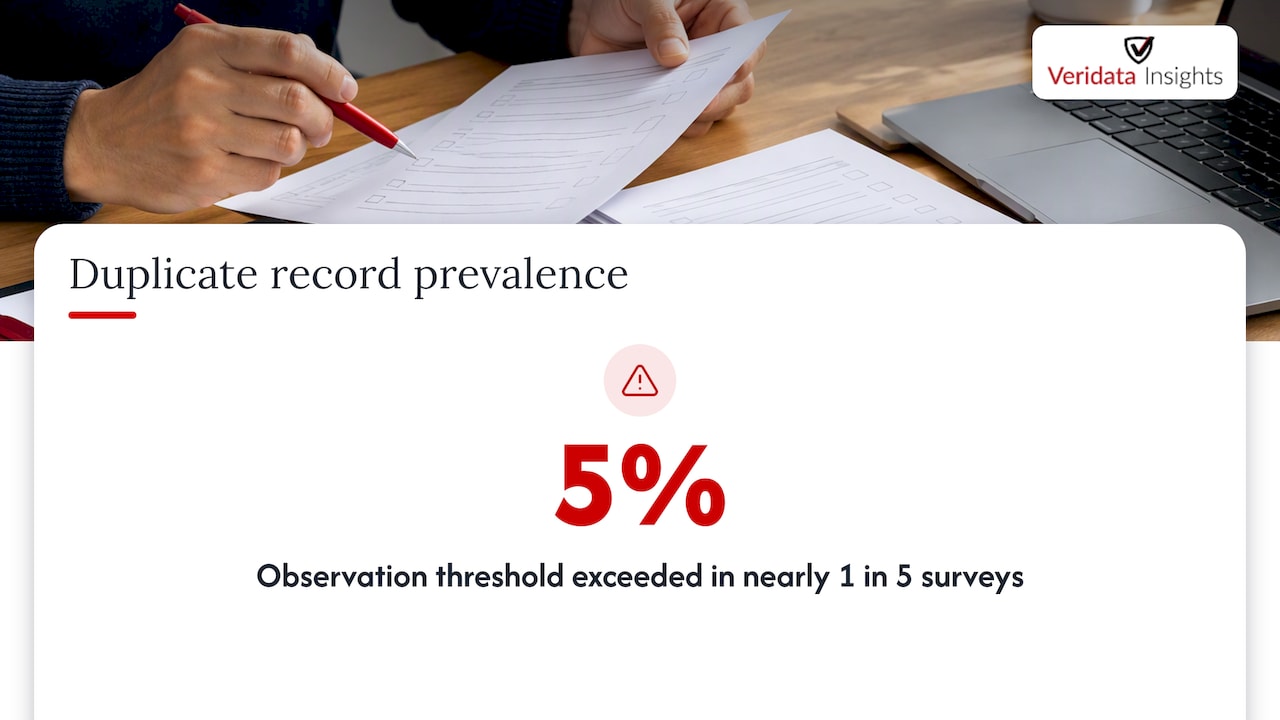
- A study found nearly 1 in 5 surveys had duplicate or near duplicate records exceeding 5% of observations, risking inflated samples and narrower confidence intervals.
- Treat matches above roughly 85% as review candidates, not proof of fraud; short questionnaires, split ballots, and skip patterns can raise similarity naturally.
- Pair percent match with exact ID checks, text similarity for open responses, and metadata such as timestamps, interview duration, GPS, device IDs, and IP addresses.
- Retain an isolated, weakly supported doublet with a flag for sensitivity tests; use inverse multiplicity weighting for clusters, and remove only when fraud is documented.
Table of Contents
- Why duplicate and near-duplicate records distort your results
- How duplicates get into your data and why some evade detection
- Detection methods: exact-match, percent-match, fuzzy similarity, and forensic checks
- A step-by-step workflow for identifying and resolving duplicates
- Field-tested tools and code for scaling your duplicate checks
- How we help teams dedupe survey data without guessing
- Let us handle the forensic checks so your data holds up
- FAQ
- Sources
Why duplicate and near-duplicate records distort your results
A duplicate record is an exact copy of another response: same answers, same identifiers, same timestamp pattern. A near-duplicate shares most but not all values, often because someone changed one variable, a timestamp, or an ID string to dodge a simple matching check. Researchers sometimes call either type a non-unique record, or NUR, when the goal is to describe the broader problem rather than the mechanism behind it.
These aren’t rare edge cases. Analysis of widely used country-year surveys found that nearly 1 in 5 contain duplicate or near-duplicate records exceeding 5% of observations, a rate high enough to shift published findings.
A meaningful share of widely used country-year surveys show duplicate or near-duplicate records exceeding 5% of observations, which means some published research may rest on inflated sample sizes and artificially tight confidence intervals, according to Kuriakose and Robbins’ analysis.
The statistical damage runs deeper than a slightly larger n. Duplicates shrink variance artificially, which inflates statistical power and makes weak or nonexistent effects look significant. In regression work, duplicated observations don’t just add noise, they can anchor estimates around a biased mean, especially when the duplicated cases share unusual characteristics. Monte Carlo simulations show that even small outliers get treated as robust patterns once they’re copied several times over, turning a single fabricated interview into something that looks like a genuine finding repeated across a subgroup.
How duplicates get into your data and why some evade detection
Duplicates arrive through a handful of recognizable paths, and knowing which one you’re dealing with changes how you investigate.
- Interviewer or agency curbstoning: a fieldworker fabricates part or all of an interview and reuses responses from a prior case to save time.
- Respondent repeats: the same person completes an online survey more than once, often chasing an incentive payment.
- Processing or ID collisions: a technical error during data merging or export assigns the same identifier to two separate records.
Sloppy fabrication produces exact duplicates that a simple match catches in seconds. Skilled evasion looks different. A falsifier who wants to pass a duplicate check might change one answer on a long battery, nudge a timestamp by a few minutes, or alter a single digit in an ID string. None of that fools a percent-match calculation, but it does defeat exact-match scanning entirely, since exact-match only flags records that are byte-for-byte identical.
Pro Tip: Never rely on exact-match alone as your only duplicate check; pair it with an affinity or percent-match measure so altered records still surface.
This is the operational lesson for anyone cleaning survey data: a clean exact-match report tells you almost nothing about near-duplicates, and near-duplicates are where the real fraud risk concentrates.
Detection methods: exact-match, percent-match, fuzzy similarity, and forensic checks
Four complementary techniques cover most of what you’ll need, and none of them work well alone.
- Exact-match scanning compares full records for identical values across all variables; it’s fast and catches ID collisions and lazy duplication, but misses anything altered even slightly.
- Percent-match (affinity) analysis computes, for every record, its highest percentage match against any other record in the dataset, then flags the right tail of that distribution for review.
- Fuzzy or text-similarity matching handles open-text fields and near-identical numeric patterns using string-distance comparisons, useful when respondents or interviewers paraphrase instead of copying verbatim.
- Paradata and metadata forensics cross-check timestamps, interview duration, GPS coordinates, device ID, and IP address against the substantive responses to corroborate or contradict a percent-match flag.
The percent-match approach has the strongest academic grounding. Kuriakose and Robbins found that the distribution of maximum percent-match values across clean survey data approximates a Gumbel distribution, a specific shape with a long but thin right tail. Matches above roughly 85% are extremely unlikely to occur by chance in legitimate data, according to their simulation and empirical analysis, which makes that threshold a useful soft ceiling rather than a hard rule.
Plot your dataset’s percent-match distribution against the expected Gumbel curve and look for a spike or bulge in the tail: a smooth decline suggests ordinary coincidental similarity, while a visible spike above the curve suggests something systematic. Short surveys with few questions and limited response options will show naturally higher percent-match rates simply because there are fewer ways to answer differently, so adjust your threshold for questionnaire length before panicking about a cluster of near-identical cases. Split-ballot designs and heavy skip patterns also inflate apparent similarity for reasons that have nothing to do with fraud, so control for those structural features before you trust a raw percent-match score.
Fuzzy matching earns its place on open-ended questions, where a falsifier copying a prior respondent’s answer might reword a phrase rather than retype it verbatim. Combine all four methods and cross-reference the flags: a record that shows up in percent-match, carries a suspicious paradata signature, and shares an interviewer ID with another flagged case deserves a close look well before you consider removing anything.
A step-by-step workflow for identifying and resolving duplicates
A reproducible process beats ad hoc spot-checking every time, and it gives you a defensible paper trail if anyone questions your results later.
- Prepare: duplicate your raw data file before touching anything, then compute the baseline percent-match distribution and plot it against the expected Gumbel curve to see where your dataset’s tail actually sits.
- Flag: build a candidate list by combining percent-match scores above your chosen cutoff, any exact ID duplicates, and paradata anomalies like implausible interview durations or GPS clusters.
- Investigate: for each candidate pair, compare interviewer IDs, timestamps, and source identifiers, then read through the substantive answers for differences that matter. Export the findings into a structured investigation template with fields for duplicate set ID, kept or removed status, evidence notes, and multiplicity count.
- Decide: a single isolated doublet with weak evidence usually gets flagged and retained with a dummy variable so analysts can test sensitivity; a cluster of several duplicates tied to one interviewer or source generally calls for inverse-multiplicity weighting; clear, documented fraud, corroborated by paradata and interviewer patterns, is the case for removal.
- Document: log every decision in a change file, add a permanent flag variable to the working dataset, and keep the untouched raw file archived so the entire process can be reproduced or audited later.
Pro Tip: When multiple doublets share the same source or interviewer, weight by inverse multiplicity rather than deleting outright. Comparative evaluation found inverse-multiplicity weighting minimizes estimation bias better than simple deletion when several duplicate sets are present.
The decision heuristic boils down to multiplicity and evidentiary strength. One ambiguous doublet rarely justifies removal on its own, since you risk discarding a legitimate respondent who happens to resemble another. A pattern of many duplicates, especially from the same source, strengthens the case for weighting or removal, and the AAPOR Data Falsification Task Force recommends documenting suspected falsification thoroughly rather than quietly deleting records, since that documentation is what lets other researchers trust your published numbers. Readers who want a fuller checklist for the surrounding cleaning process can check our guide to survey data cleaning for related QA steps.
Field-tested tools and code for scaling your duplicate checks
You don’t need to build percent-match logic from scratch. A dedicated Stata program, built specifically for this task, computes each record’s maximum percent match against every other case and outputs both a summary statistic and a histogram you can compare against the Gumbel benchmark described earlier; a visible spike in the right tail is your cue to pull those cases for investigation.
For teams running SurveyCTO or ODK data collection, iefieldkit offers two commands worth knowing. Its duplicate-detection command identifies duplicated ID values during fieldwork, and its comparison command exports a structured template for resolving which record to keep, which to discard, or which to merge, which maps directly onto the investigate and document steps above.
- Blocking before comparing: pre-filter candidate pairs using a few high-information variables (sex, age bucket, region, a hashed fingerprint of several key answers) so you’re not running full percent-match calculations across every possible pair.
- R and Python options: string-distance libraries like
stringdistin R orrapidfuzzin Python handle fuzzy text comparisons, while approximate-nearest-neighbor methods scale pairwise checks across large datasets without exhaustive comparison. - Compare on substantive variables only: strip out metadata and free-text fields that don’t carry research meaning before running similarity scores, which speeds up processing and reduces noise.
- Persist your outputs: save investigation templates and match scores as code-driven logs rather than manual spreadsheets, so the entire process can be rerun exactly on updated data.
A reproducible pipeline, whether built in Stata, R, or Python, turns deduping from a one-off cleanup task into a documented, repeatable part of your quality control.
How we help teams dedupe survey data without guessing
We build data processing and forensic checks directly into our full-service market research engagements, so duplicate detection isn’t an afterthought tacked onto the back end of a project. We apply an identify, investigate, decide, and document workflow as standard practice, ensuring every flagged case is documented with a rationale clients can present to stakeholders or reviewers. For readers managing hard-to-reach or global samples where duplication risk runs higher, our capabilities page outlines the programming and processing services that support this work end to end.
Let us handle the forensic checks so your data holds up
Catching duplicates after the fact is a lot harder than building clean collection and verification into a project from the start, and that’s exactly where our team spends its time. Size isn’t everything. Quality matters, and that’s the whole point of combining percent-match diagnostics, paradata review, and documented decision rules on every dataset we touch.
Whether you need full data processing on an existing dataset or want forensic checks built into a new quantitative study from day one, our quantitative market research team can scope it with you, seven days a week, with no project minimums standing in the way.
FAQ
What does it mean to dedup data?
Deduping data means identifying exact or near-duplicate records in a dataset and deciding how to handle them: flag them for review, weight them to reduce bias, or remove them when fraud is confirmed. It’s a quality control step, not a simple delete function, because context determines the right fix.
What are some examples of data deduplication?
Common examples include removing a respondent who completed the same online survey twice for an incentive, flagging an interviewer who reused a prior interview’s answers with minor edits, and resolving an ID collision caused by a data export error. Each example calls for a different detection method, from exact-match scanning to percent-match analysis.
How do you deduplicate data?
Start by computing a percent-match score for every record, then inspect the right tail of that distribution against exact ID duplicates and paradata anomalies like implausible timestamps or GPS clusters. Investigate flagged pairs individually before deciding whether to flag, weight by inverse multiplicity, or remove, and document every decision in a change log.
Is it de duplication or deduplication?
Both spellings appear in practice, but “deduplication” written as one word is the more common and widely used form in data quality and survey research contexts. Either way, the term refers to the same process of finding and resolving duplicate records.
What threshold should I use to flag suspicious duplicates?
A percent-match score above roughly 85% is a useful starting point for inspection, based on Gumbel-distribution behavior observed across many clean surveys, but adjust it for questionnaire length and skip patterns before treating any single case as confirmed fraud. Always pair a percent-match flag with paradata review rather than acting on the score alone.
Sources
- Don’t Get Duped: Fraud through Duplication in Public Opinion Surveys (Kuriakose & Robbins)
- Assessing duplicate records’ effects and remedies (MPRA / Monte Carlo study)
- AAPOR Data Falsification Task Force Report