Survey data cleaning is the process of making raw responses analysis-ready by detecting and reducing non-random errors, removing ineligible or low-quality entries, standardizing formats, handling missing values, and documenting every decision. The verdict: run a fast pre-check, cut ineligible and low-quality responses, standardize and validate, log every change, then re-check results with sensitivity tests.
Do this before you touch your analysis:
- Preserve the raw export untouched, in its own file.
- Run platform-level filters (duplicate IP, bot detection, speeder flags).
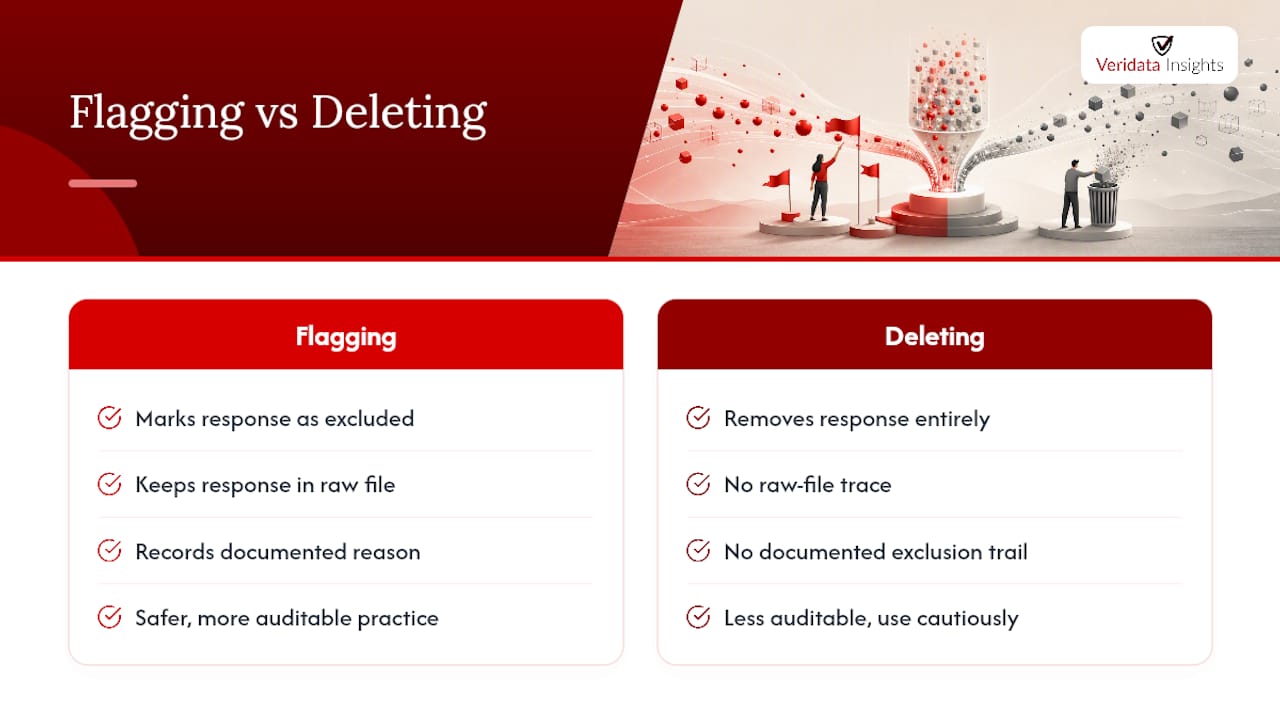
- Flag ineligible respondents rather than deleting their rows outright.
- Set exclusion flags with reasons attached, not silent deletions.
- Note your predicted exclusion rate before you start cutting.
A dataset you have not audited is a dataset you cannot defend. Flag first, delete never, document always.
From here, run the full workflow below, keep a cleaning log as you go, and re-run validation checks once you’re done.
Key Takeaways
Survey data cleaning works because it isolates non-random error through layered detection, flags rather than deletes, and documents every decision so results hold up under review.
| Point | Details |
|---|---|
| Preserve raw data | Keep the original export untouched and work from copies at every cleaning stage. |
| Expect 5 to 15% exclusion | Use this as your baseline; investigate design if your rate falls far outside it. |
| Combine detection indices | Flag bad respondents only when two or more indices, like IRV and odd-even correlation, agree. |
| Match imputation to mechanism | Diagnose MCAR, MAR, or MNAR before choosing listwise deletion, mean imputation, or regression-based methods. |
| Get audit-grade support | Veridata Insights builds pre-registered cleaning protocols and forensic screening for studies that need documented, defensible results. |
Table of Contents
- What Is Survey Data Cleaning and Why It Matters
- Pre-Clean Checklist: 7 Things to Check Before You Start
- A Step-by-Step Cleaning Workflow You Can Run Now
- How Do You Detect Bad Respondents and Bots?
- Handling Missing Data: MCAR, MAR, and MNAR
- Documenting Every Cleaning Decision for QA
- Which Tools Speed Up Common Cleaning Tasks?
- Veridata Insights’ Take: Realistic Stopping Rules
- When to Bring in Veridata Insights for Cleaning Support
- Frequently Asked Questions
- Sources
What Is Survey Data Cleaning and Why It Matters
Survey data cleaning reduces non-random error, meaning the mistakes, fraud, and inattention that skew results in one direction rather than scattering randomly. A peer-reviewed primer on data cleaning frames this precisely: cleaning detects inconsistencies, corrects errors, handles missing data, and must be reported because every edit changes your variance estimates. Skip it and you risk biased means, false-positive findings, and a client who stops trusting your numbers.
The Total Survey Error framework treats cleaning as one lever among several (sampling, measurement, nonresponse) that all push error in the same direction if left unchecked.
By the numbers: rigorous screening can remove 20 to 32% of web-based survey responses in some studies, driven mostly by inattentive respondents and bots. A dataset that looks clean at around 500 completes might yield fewer defensible ones after screening. That gap changes your margin of error and your confidence in every crosstab that follows.
- Biased estimates from uncaught speeders or straight-liners
- False discoveries in subgroup analysis
- Credibility loss when a client’s own reviewer spots an obvious bot response
Pre-Clean Checklist: 7 Things to Check Before You Start
Before you open a single crosstab, run rapid triage. This keeps your downstream cleaning focused and, just as important, reproducible for anyone reviewing your work later.
- Export the raw file first and never edit it directly. Work from a copy.
- Preserve a master version with a timestamp and version number.
- Check platform-level protections already applied (CAPTCHA, duplicate IP blocking, panel-level fraud flags).
- Verify eligibility criteria against screener logic, not just completion status.
- Set completion thresholds (partial completes below what percent get dropped versus flagged).
- Scan for attention-check failures and note where they occurred in the survey flow.
- Run a duplicate check on IP address, device fingerprint, and open-ended text similarity.
Industry practice treats a 5 to 15% exclusion rate as a reasonable baseline for a well-fielded online survey. If your predicted rate is far outside that range, the problem may be your survey design or panel source, not your cleaning rules.
Pro Tip: Lock your exclusion thresholds and write down your predicted exclusion rate before you look at the data. Deciding “we’ll cut anyone under 90 seconds” after you’ve already seen the completion times is how QA analysts unconsciously bias their own cleaning.
Good survey design upstream reduces how much triage you need downstream in the first place.
A Step-by-Step Cleaning Workflow You Can Run Now
Run these steps in order. Each one changes the dataset in a specific, checkable way, and skipping ahead usually means redoing work later.
1. Preprocessing. Standardize variable names, recode open text into consistent categories, and confirm data types match your codebook (dates as dates, numeric fields as numeric). This is the boring step nobody wants to do, and it’s also the one that prevents a merge error from silently corrupting your file three steps from now.
2. Deduplication. Check for exact duplicate rows first, then near-duplicates: same IP, same device ID, near-identical open-ends submitted minutes apart. A seven-step cleansing framework treats deduplication as step two for a reason. It’s cheap to run and it catches an entire category of fraud before you waste time on anything more subtle.
3. Fix structural errors. Correct inconsistent category labels (“Male”/“M”/“male” should be one value), fix out-of-range numeric entries, and reconcile skip-logic violations where a respondent answered a question they should have skipped.
4. Screen for respondent quality. Apply your attention-check rules, speeder thresholds, and straight-line detection (covered in depth in the next section). Flag, don’t delete yet.
5. Handle outliers and missing values. Use visual checks (box plots, histograms) and statistical thresholds like interquartile range or Z-scores to spot anomalies, as outlined in Principles of Data Science. Decide your missing-data strategy here (detailed in Section 6).
6. Standardize formats. Align date formats, currency units, and scale directions (make sure every 1-to-5 satisfaction scale points the same way) across the full file.
7. Final validation. Re-run your summary statistics, compare pre- and post-cleaning sample sizes by key subgroup, and confirm nothing shifted in an unexpected direction.
- Save a snapshot after each major step (preprocessed, deduplicated, quality-screened, final) so you can trace exactly where a number changed.
- Check total N, mean, and key crosstabs after every step, not just at the end.
- Keep a running tally of how many rows each step removed or flagged.
Pro Tip: Name your snapshot files with the step number and date, not just “cleaned_final” and “cleaned_final_v2.” Six months from now, a reviewer (possibly you) will need to know exactly which version produced which chart.
How Do You Detect Bad Respondents and Bots?
Bad respondents fall into a few recognizable patterns: speeders who blow through a 15-minute survey in three, straight-liners who click the same response option down an entire grid, and random responders whose answers show no internal logic at all. Bots increasingly mimic human timing, which is why rule-based filters alone aren’t enough anymore.
Run detection in layers rather than relying on one signal:
- Rule-based, during fielding: minimum completion time, honeypot fields (a hidden question only a bot would answer), attention-check items embedded mid-survey.
- Statistical indices, post-export: Individual Response Variability (IRV) to catch straight-lining, odd-even correlation to catch random responding, and Mahalanobis distance to catch response patterns that don’t resemble anyone else’s.
- Model-based detection for large samples, where machine-learning classifiers can catch subtler bot signatures rule-based filters miss.
A three-layer detection strategy like this, moving from simple rules to statistical indices to model-based review, catches more fraud than any single method alone.
Statistic to watch: combining two or more indices with AND logic (flag only if IRV and odd-even correlation both fail) meaningfully reduces false positives compared with cutting on a single index.

Pro Tip: Never exclude on one metric alone. A genuinely fast, attentive respondent can trip a single speed threshold; a bot rarely passes two independent statistical checks at once. Veridata Insights walks through these forensic markers and verification methods in more depth for teams building their own detection rules.
Handling Missing Data: MCAR, MAR, and MNAR
Start by diagnosing why data is missing, because the mechanism determines the fix. Data missing completely at random (MCAR) has no pattern tied to any variable. Missing at random (MAR) correlates with something you observed (older respondents skip income questions more often). Missing not at random (MNAR) correlates with the missing value itself (people with high income skip the income question specifically).
- MCAR: listwise deletion is usually safe since it won’t bias your estimates.
- MAR: mean or median imputation works for simple cases; regression or KNN imputation performs better when the missingness pattern is complex.
- MNAR: treat with caution. No imputation method fully corrects for it, so flag the pattern in your reporting rather than papering over it.
Pro Tip: Rerun your key results using two or three imputation approaches. If your headline finding shifts meaningfully between methods, report the range rather than picking whichever number looks best.
Documenting Every Cleaning Decision for QA
A defensible dataset comes with a paper trail. That means preserving the raw file untouched, logging every step you ran, and attaching a reason to every exclusion flag rather than a bare “removed.”
- Keep raw data in a separate, write-protected file.
- Log each cleaning step with a timestamp and the rule applied.
- Record the row count at every stage, from raw export to final analysis file.
- Report a before/after summary in your methods section: starting N, excluded N by reason, final analysis N.
Pro Tip: A reviewer should be able to reproduce your exclusions from your log alone, without asking you a single question. This is also where respondent validation practices earn their keep, since they give you a documented basis for every flag rather than a judgment call made in the moment.
Which Tools Speed Up Common Cleaning Tasks?
You don’t need enterprise software to run a solid cleaning pass, though the right tool for the job matters. Spreadsheet functions handle basic deduplication and format fixes on smaller datasets. R and Python script templates scale better for larger samples and let you calculate IRV, flag speeders by percentile, and standardize date formats in a few reusable lines rather than manual edits. Platform-level filters catch obvious fraud before export. Dedicated deduplication libraries and imputation packages (KNN, regression-based) handle the more statistical steps.
- Histograms to spot unusual clustering in numeric responses
- Box plots to flag outliers in continuous variables
- Response-time density plots to visually confirm your speeder threshold
Automated tools handle the structural fixes well, but domain expertise still matters for edge cases a script won’t catch, like a respondent who answered honestly but misunderstood a poorly worded question.
Veridata Insights’ Take: Realistic Stopping Rules
Perfect data doesn’t exist, and chasing it wastes time you should spend on analysis. Our approach at Veridata Insights centers on non-random error: fraud, inattention, and bots, not the ordinary noise every survey carries.
Flag with reasons, preserve the raw file, and combine detection indices with AND logic before you cut a single response. A clean dataset is a documented one, not a spotless one.
Fall well outside it in either direction and the issue usually traces back to panel quality or survey design, not your cleaning rules. A basic audit protocol works for most projects: pre-register your thresholds, run rule-based filters during fielding, apply statistical indices after export, and log every flag with its reason before you touch the analysis file.
Pro Tip: If your exclusion rate keeps landing outside the 5 to 15% baseline project after project, stop adjusting your cleaning rules and start auditing your questionnaire design instead.
When to Bring in Veridata Insights for Cleaning Support
Some projects need more than a solid internal checklist. When a study demands audit-grade documentation, complex forensic screening across multiple markets, or reproducible thresholds a client’s own statisticians will scrutinize, that’s when hands-on support pays for itself.
Veridata Insights builds cleaning protocols around the same principles covered here: pre-registered thresholds, multi-index forensic screening, and a full documented log of every exclusion, no project too small and no scope too unusual.
- Custom cleaning protocol design tied to your specific questionnaire and audience
- Threshold pre-registration before fielding begins
- Forensic screening for bots, speeders, and inconsistent respondents across B2B, B2C, healthcare, and hard-to-reach samples
- Complete cleaning logs delivered alongside your analysis-ready dataset
If your next study needs that level of rigor, reach out to Veridata Insights to scope the cleaning and QA work before fielding starts, not after the data lands in your inbox.
Frequently Asked Questions
What is survey data cleaning?
Survey data cleaning is the process of detecting and correcting non-random errors, such as fraud, inattention, and structural inconsistencies, in raw survey responses before analysis. It includes deduplication, standardization, missing-data handling, and documentation of every edit.
How much data should I expect to exclude?
A 5 to 15% exclusion rate is a reasonable industry baseline for well-fielded online surveys. Some studies report 20 to 32% removal when panel quality is weaker or screening is unusually thorough.
What’s the difference between flagging and deleting responses?
Flagging marks a response as excluded with a documented reason while keeping it in the raw file. Deleting removes it entirely. Flagging is the safer, more auditable practice because it lets a reviewer trace and challenge every exclusion decision.
How do I know if missing data is MCAR, MAR, or MNAR?
Check whether missingness correlates with observed variables (suggesting MAR) or seems tied to the missing value itself, like high earners skipping an income question (suggesting MNAR). No correlation with anything measurable points to MCAR.
Can automated tools fully replace manual review?
No. Automated tools and scripts handle structural fixes, deduplication, and statistical flagging efficiently, but domain expertise still matters for edge cases, like a respondent who misread a question rather than answered carelessly.
Sources
For the forensic detection layer, consult the three-layer careless-responding framework. For missing-data mechanisms, see Principles of Data Science. For pipeline design and merging external sources, review the data integration and cleaning pipeline. For a full 15-step checklist, see the complete cleaning checklist for survey research.
- A Primer of Data Cleaning in Quantitative Research – PMC – NIH
- Principles of Data Science — Data cleaning and preprocessing
- The Complete Data Cleaning Checklist for Survey Research: 15 Steps to Analysis-Ready Data – Next Publishers
- Survey data cleaning: Detecting careless responding and setting exclusion thresholds | Kicue
- Integrate