
TL;DR:
- Reliable financial research depends on data quality, and a disciplined collection process ensures accuracy and validation. Utilizing primary, secondary, and alternative sources with thorough planning, automation, and cross-checking improves data integrity and timeliness. Common pitfalls include inconsistent formats, stale data, and lack of lineage, which can be mitigated through standardized workflows and rigorous validation.
Reliable financial research lives or dies by the quality of its data. Most analysts know this. Fewer actually have a disciplined, repeatable process for getting it right. This data collection guide for financial research covers the full picture: from identifying the right data types and sources, to executing collection efficiently, to validating what you’ve gathered before it ever touches a model. Whether you’re tracking private funding rounds, building sector forecasts, or conducting primary market research, the methods and best practices here will sharpen every phase of your process.
Table of Contents
- Key takeaways
- Data collection guide for financial research: types and sources
- Planning your financial data collection
- Executing financial data collection effectively
- Common pitfalls in financial data collection
- Verification and validation of collected financial data
- My take on what financial data collection actually demands
- Let Veridatainsights handle the heavy lifting
- FAQ
Key takeaways
| Point | Details |
|---|---|
| Match data type to objective | Primary, secondary, and alternative data each serve distinct research purposes and work best in combination. |
| Plan before you collect | Define your research questions, variables, and compliance requirements before touching a single data source. |
| Automate where it counts | Automated aggregation platforms handle repeated ingestion reliably; reserve manual extraction for one-off tasks. |
| Validate at every layer | Cross-source triangulation and automated anomaly detection together catch errors that either method misses alone. |
| Maintain data lineage | Audit trails protect your work under scrutiny and are non-negotiable for compliance-driven financial research. |
Data collection guide for financial research: types and sources
Before you design a collection plan, you need to know what you’re collecting and where it actually lives. Financial data falls into three broad categories, and serious research draws from all three.
Primary data comes from the source. Surveys of institutional investors, in-depth interviews with supply chain managers, or direct feedback panels with retail consumers give you information no public database will ever contain. This is where qualitative texture meets quantitative measurement. It’s resource-intensive, but it tells you what happened and why.
Secondary data is pre-existing. Think regulatory filings, government databases, and industry reports. The Federal Reserve’s FRED database, World Bank datasets, and SEC filings are workhorses here. SEC Form D filings, for example, must be submitted within 15 days of a company’s first capital raise under Regulation D, making them one of the most timely public signals for tracking private funding activity. Analysts who monitor these filings regularly catch funding trends well before they appear in press coverage.
Alternative data is where competitive edges increasingly get built. Real-time consumer signals from transaction panels, satellite imagery of parking lots or shipping containers, web-scraped pricing data, and social media sentiment all capture what’s happening right now rather than what happened last quarter. Traditional financial data is inherently backward-looking. Alternative data changes that equation.
Key source categories to map for any research project:
- Regulatory databases: SEC EDGAR, FINRA, state-level filings
- Macroeconomic databases: FRED, World Bank, IMF Data
- Syndicated research: industry reports tracking pricing, sales, and utilization trends
- Alternative feeds: transaction data providers, geospatial data, web scraping pipelines
- Primary research panels: surveys, interviews, expert networks
Pro Tip: Don’t treat source selection as a formality. Document every source before collection begins. You’ll thank yourself during the validation phase when you need to trace a number back to its origin.
Planning your financial data collection
Good data collection is mostly preparation. The execution is almost mechanical if the planning is thorough.
Here are the steps for effective financial research planning that experienced analysts actually follow:
- Define your research questions precisely. Vague objectives produce vague data. “Understand market dynamics” is not a research question. “Quantify quarterly pricing trends in middle-market SaaS across North America” is.
- Identify the variables and metrics you need. List every data point your analysis requires. Separate what’s necessary from what would be nice to have. This prevents scope creep during collection.
- Assess data availability for your market. Mature markets like U.S. public equities have deep data ecosystems. Emerging markets or niche sectors may require heavier reliance on primary research and alternative sources. Your source strategy has to reflect what actually exists, not what you wish existed.
- Choose collection frequency and time horizons. Daily transaction data and quarterly survey results require completely different infrastructure and timelines. Decide early.
- Build compliance and ethics into the plan. Data privacy regulations, terms of service on web-scraped sources, and institutional data governance policies are not afterthoughts. If your collection method creates legal exposure, redesign it before you build it.
- Document your methodology. Standards like GIPS exist precisely because undocumented methodology erodes trust. Your collection plan is part of your research’s audit trail.
Pro Tip: Run a short feasibility check before committing to any primary data collection instrument. Test your survey with five respondents or conduct two pilot interviews. You’ll catch design flaws before they contaminate a full dataset.
The planning stage is where mixed methods research approaches earn their value. Combining qualitative depth with quantitative breadth at the design stage, rather than bolting them together after the fact, produces far more defensible research outputs.

Executing financial data collection effectively
Planning tells you what to collect. Execution is where you actually get it. Here’s where financial data gathering techniques diverge sharply based on scale, frequency, and source type.
Manual extraction works for one-off tasks: pulling a specific 10-K filing, downloading a World Bank dataset for a single country, or conducting a targeted interview series. It’s fast to set up and requires no infrastructure. But it does not scale, and it introduces human error at volume.
Automated aggregation is the standard for any repeated or high-volume collection. Pre-built connector platforms ingest financial data in formats including CSV, XML, and JSON, automating the normalization that would otherwise consume hours of analyst time. These platforms handle hundreds of proprietary formats, mapping fields and flagging validation exceptions without manual intervention.
API integrations sit in the middle. Most major financial data providers, including Bloomberg, Refinitiv, and government statistical agencies, offer API access. Connecting your research environment directly to these APIs eliminates the lag and transcription errors that come with manual downloads. Bloomberg’s Point-in-Time dataset gives analysts access to over 3,000 economic indicators across 100-plus economies, with historical data extending back to 1997, all accessible via API and structured for backtesting.
Web scraping handles sources without official APIs. Tools like Python’s BeautifulSoup handle static pages well. Dynamic, JavaScript-rendered pages from sources like Yahoo Finance or SEC EDGAR require tools like Selenium to render content before extraction. Keep in mind that scraper maintenance is ongoing work. Source formats change, access policies evolve, and scrapers built six months ago routinely break without warning.
| Collection method | Best use case | Key limitation |
|---|---|---|
| Manual extraction | One-off or ad hoc research tasks | Does not scale, error-prone at volume |
| Automated aggregation | Recurring, high-volume data pipelines | Requires upfront configuration investment |
| API integration | Structured feeds from major providers | Subject to provider rate limits and cost |
| Web scraping | Sources without API access | Maintenance burden as source formats change |
For SEC Form D monitoring, automated daily scraping of EDGAR combined with a structured database is how sophisticated analysts build funding trackers that surface private capital activity in near real time.
Common pitfalls in financial data collection
Even well-planned collection projects hit problems. Knowing the most common ones in advance lets you design around them.
- Inconsistent formats across sources. Dates formatted as MM/DD/YYYY in one source and YYYYMMDD in another will silently corrupt merged datasets. Build format normalization into your pipeline from day one, not as a cleanup step at the end.
- Stale or lagging data. Financial research that relies on quarterly-reported figures for signals that move daily is structurally disadvantaged. Audit the refresh frequency of every source in your plan against the time sensitivity your analysis actually requires.
- Data duplication. When you pull from multiple vendors who each license the same underlying data, you can easily end up counting the same transaction or event twice. Cross-referencing unique identifiers, like CUSIPs for securities or EIN numbers for companies, catches this before it inflates your counts.
- Dynamic webpage breakage. Web scrapers fail when sites update their HTML structure. This is not an edge case. It happens constantly with financial news sites, regulatory portals, and data aggregators. Build alerts that detect when expected data stops arriving.
- Inadequate data lineage. If you can’t trace a data point back to its original source and collection timestamp, it is not defensible in a research context. Data lineage documentation is a compliance requirement in many institutional settings and a basic quality standard everywhere else.
Pro Tip: Triangulation is the most reliable quality control you have. Combining primary, secondary, and alternative sources to cross-check key findings catches errors and biases that no single source validation ever will.
Verification and validation of collected financial data
Collected data is raw material. Before it enters any model or analysis, it has to be verified. This is where data collection best practices pay their most obvious dividends.
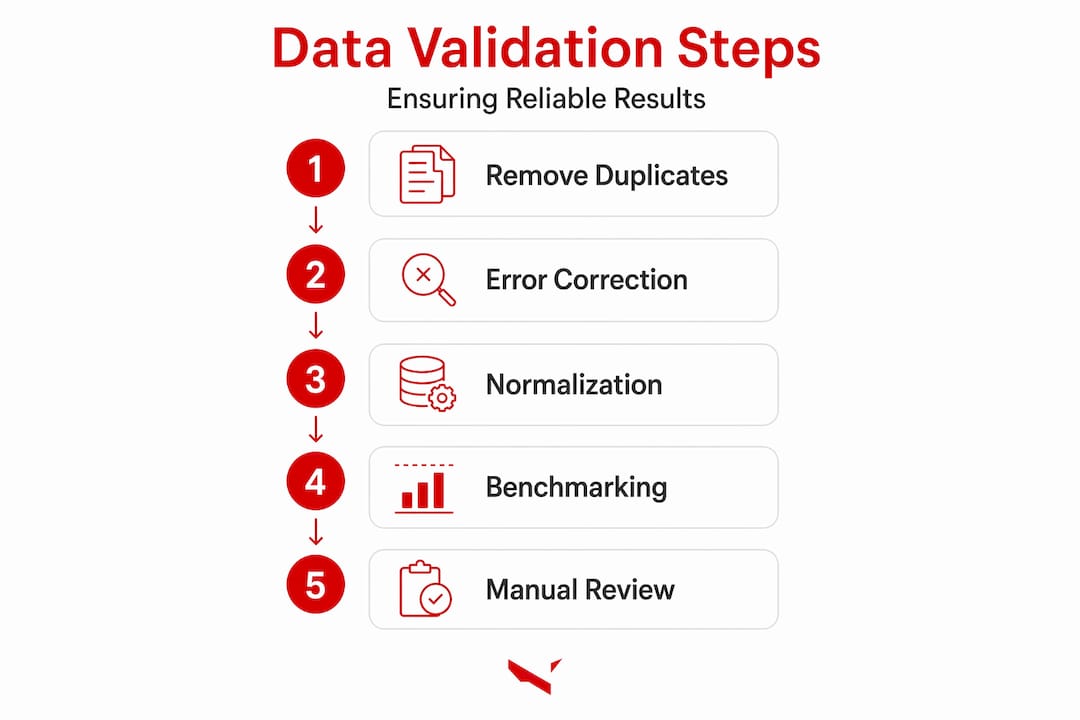
The core validation workflow for financial research looks like this:
| Validation step | What it does | Why it matters |
|---|---|---|
| Duplicate removal | Identifies and eliminates repeated records | Prevents inflation of counts or averages |
| Error correction | Flags values outside expected ranges | Catches transcription and formatting errors |
| Cross-source benchmarking | Compares your figures against industry standards | Reveals systematic bias or source-specific errors |
| Normalization | Standardizes units, currencies, and time periods | Makes datasets from different sources comparable |
| Anomaly monitoring | Flags statistically unusual values for review | Catches bad data before it enters models |
Removing duplicates and correcting errors before analysis strengthens forecasting model reliability significantly. This is not optional cleanup work. It is where research quality is determined.
Automated tools can run the first pass on all five steps. But automated systems miss context-dependent errors that a trained analyst catches immediately. The standard in high-stakes financial research is multi-layer validation: automated detection identifies candidates for review, and human judgment makes the final call on borderline cases.
Cross-source benchmarking deserves special attention. If your primary survey data on consumer sentiment diverges sharply from transaction panel data covering the same population, that gap is information. It signals either a measurement difference, a sampling issue, or a real behavioral discrepancy worth investigating. Don’t average it away. Understand it.
My take on what financial data collection actually demands
I’ve worked with financial researchers across enough projects to say this directly: data collection is almost always the most underestimated phase of any research engagement. Analysts spend enormous energy on modeling and analysis but treat collection as an administrative task. That ordering gets the effort distribution exactly backwards.
The researchers who produce consistently credible work share a few habits. They plan collection methodology with the same rigor they apply to analysis. They document everything, not because they expect to be audited, but because they know their future selves will need the audit trail. And they are disciplined about triangulation. No single source, however prestigious, gets the final word without cross-checking.
My strongest advice for anyone building out their data collection strategies for finance: start combining traditional and alternative data sources sooner than feels necessary. The timing advantage that alternative data provides is real. Waiting until a dataset becomes mainstream means you’re using it when everyone else is too, which defeats most of its value.
The other thing I’d push back on is the instinct to automate everything immediately. Automation is powerful, but it requires ongoing maintenance that many teams underestimate. A pipeline that runs unmonitored for six months is a pipeline that has been silently delivering bad data for six months. Automation paired with rigorous monitoring is the standard worth building toward.
— Daniel
Let Veridatainsights handle the heavy lifting
Data collection in finance is complex, time-sensitive, and unforgiving of shortcuts. Veridatainsights works with financial researchers and analysts to design and execute collection programs that hold up under scrutiny, whether that means building a primary research panel, structuring an alternative data integration, or managing end-to-end data processing and validation.
There are no project minimums. We work seven days a week, 365 days a year, and we can do as much or as little of the process as your team needs. If you’re ready to get better data into your research, we’d like to talk. Reach out through our contact page and tell us what you’re working on.
FAQ
What is the best approach to collecting financial data?
The most reliable approach combines primary research, secondary databases, and alternative data sources, then cross-validates findings across all three. This triangulation method catches errors and biases that relying on any single source will miss.
How do SEC Form D filings help in financial research?
SEC Form D filings must be submitted within 15 days of a first capital raise, making them one of the most timely public sources for tracking private U.S. funding activity. Analysts who monitor EDGAR filings regularly can identify funding trends well ahead of press coverage.
What is alternative data and why does it matter?
Alternative data includes transaction panels, satellite imagery, social sentiment feeds, and web-scraped pricing information. It captures real-world signals in near real time, giving financial researchers a timing advantage over those relying only on backward-looking traditional financial reports.
How do I maintain data quality across multiple sources?
Run a multi-layer validation process that includes duplicate removal, error correction, cross-source benchmarking, normalization, and anomaly monitoring. Automated tools handle the first pass, but human review should make final calls on flagged values before data enters any model.
What are the most common financial data collection mistakes?
The biggest pitfalls are inconsistent data formats across sources, stale or low-frequency data used for time-sensitive analysis, duplicated records from overlapping vendor feeds, and missing data lineage documentation. Building normalization and lineage tracking into the pipeline from the start prevents most of these problems.
Recommended
- Data collection methods, best practices, and business impact
- Financial Services Market Research: Why Veridata Insights Is the Partner of Choice – Veridata Insights
- Data in finance: Driving strategic growth and managing risk
- Data analysis step by step for market researchers in 2026 – Veridata Insights


