TL;DR:
- Conjoint research quantifies how consumers value product features by forcing trade-offs in decision-making. It is essential for pricing, feature prioritization, and market segmentation but requires careful design and appropriate methodology selection. Proper attribute selection, sample size, and pilot testing ensure reliable insights to guide effective business decisions.
Conjoint research is a survey-based statistical method that quantifies how consumers value different product features by forcing real trade-offs during choice tasks. Unlike monadic evaluations, which ask respondents to rate products in isolation, conjoint analysis forces trade-offs that mirror how people actually decide in stores and online. The technique was formalized by Green and Srinivasan in the 1970s and has since become a standard tool in product development, pricing strategy, and market segmentation. Veridata Insights applies conjoint study methods across B2B, B2C, healthcare, and hard-to-reach audiences to deliver preference data that product teams can act on immediately.
What are the main conjoint research methodologies?
Three formats dominate conjoint analysis techniques: Choice-Based Conjoint (CBC), Full-Profile Conjoint, and MaxDiff. Each serves a different research goal, and picking the wrong one wastes budget and produces misleading results.

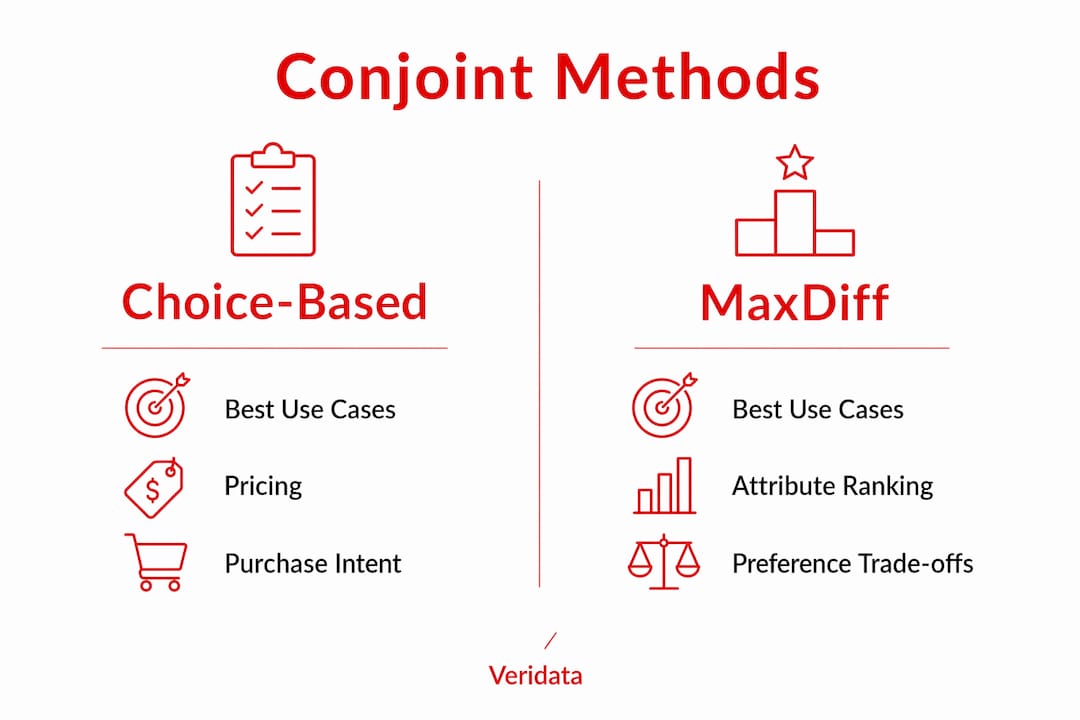
Choice-Based Conjoint (CBC) is the most widely used format. Respondents choose between sets of complete product profiles, which closely mirrors real purchase decisions. CBC predicts price sensitivity and purchase intent better than any other conjoint format. Use CBC when your primary question involves pricing, willingness to pay, or market share simulation.
Full-Profile Conjoint presents one complete product profile at a time and asks respondents to rate or rank it. This format works well for industrial or B2B products with complex specifications where respondents need time to evaluate each option. The trade-off is that it requires more survey time and can produce fatigue at scale.
MaxDiff asks respondents to identify the best and worst items from a set. It excels at ranking attribute importance across a long list of features. However, MaxDiff is ill-suited for price sensitivity or market share simulation. Researchers who use MaxDiff to answer pricing questions consistently get unreliable outputs.
| Method | Best use case | Weakness |
|---|---|---|
| Choice-Based Conjoint | Pricing, purchase intent, share simulation | Requires larger samples |
| Full-Profile Conjoint | Complex B2B products, detailed evaluation | Respondent fatigue at scale |
| MaxDiff | Feature prioritization, attribute ranking | Cannot model price or share |
Pro Tip: If your study needs to answer both “which features matter most” and “what price will the market accept,” run a CBC study. MaxDiff cannot answer the second question, no matter how well it is designed.
How do you design effective conjoint studies?
Survey design is where most conjoint studies succeed or fail. The decisions you make about attributes, levels, and experimental structure determine whether your outputs are trustworthy or garbage.
Start with attributes and levels that reflect real market choices. An attribute is a product dimension (battery life, price, color). A level is a specific value within that dimension (10 hours, 20 hours, 30 hours). Every level you include must be realistic and currently available or plausible in the near term. Unrealistic levels produce inflated utilities that cannot be translated into product decisions.
The cognitive-load sweet spot for conjoint survey design is 4–6 attributes with 2–5 levels each. Exceeding this threshold causes respondent fatigue and satisficing behavior, where respondents stop thinking carefully and just click through. Both outcomes destroy data quality.
Key design principles to follow:
- Avoid correlated attributes. If two attributes always move together in the real world (premium materials and high price), including both inflates their combined importance and distorts individual utilities.
- Use fractional factorial design to reduce the number of profiles respondents evaluate while preserving statistical independence between attributes.
- Include your current product and key competitor benchmarks as fixed profiles. This grounds the utility estimates in real market context rather than abstract preference space.
- Write attribute labels and levels in plain language. Jargon confuses respondents and introduces measurement error.
- Avoid dominant profiles, where one option is clearly superior on every attribute. Respondents will always choose it, and you learn nothing about trade-offs.
Pro Tip: Before finalizing your design, run a small pilot with 20–30 respondents. A pilot study catches confusing language, unrealistic profiles, and fatigue patterns before you spend your full data collection budget.
How do you interpret conjoint preference analysis results?
The primary output of any conjoint study is a set of part-worth utilities. A part-worth utility is a numeric score that represents how much a specific attribute level contributes to overall product preference. Higher utilities mean stronger preference. Negative utilities mean that level actively reduces appeal.
Reading attribute importance scores
Attribute importance is calculated from the range of utilities within each attribute. The wider the range, the more that attribute drives choice. If price has a utility range of 80 points and color has a range of 10 points, price is eight times more influential in purchase decisions. This is the number brand managers need when deciding where to invest in product development.
Using Hierarchical Bayes for individual-level insights
Aggregate utilities tell you what the average respondent prefers. Hierarchical Bayes (HB) estimation goes further by producing individual-level utilities for every respondent. Sample sizes of 500–1,000 respondents support HB estimation, while market share prediction may require up to 1,500. HB outputs enable market segmentation with conjoint data, letting you identify distinct preference clusters within your audience.
Running market share simulations
Market simulators take your utility estimates and predict how different product configurations would perform against each other in a competitive set. The outputs are directional, not literal. A simulation showing your new product at 34% share does not mean it will capture exactly 34% of the market. It means that configuration outperforms the alternatives in your competitive set, given the preferences measured in your sample.
Key outputs to track and act on:
- Part-worth utilities: The building block of all conjoint analysis. Check sign and magnitude for every level.
- Relative importance scores: Rank attributes by their utility range to prioritize development investment.
- Willingness-to-pay estimates: Derived from CBC utilities, these translate preference into dollar values your finance team can use.
- Segment-level utilities: Compare HB outputs across demographic or behavioral groups to find where preferences diverge.
What are the most common mistakes in conjoint research?
Even experienced researchers make design errors that compromise study validity. Knowing the most common pitfalls saves time, budget, and credibility.
- Too many attributes. Including 8 or 10 attributes feels thorough but produces noisy data. Respondents cannot meaningfully evaluate that many dimensions simultaneously. Cap your design at 6 attributes.
- Unrealistic pricing levels. Setting price levels far outside the actual market range produces utilities that look clean but predict nothing. Always anchor price levels to real market data.
- Ignoring attribute correlation. Including both “organic ingredients” and “premium price” as separate attributes in a food study creates multicollinearity. The model cannot separate their effects cleanly.
- Overinterpreting share simulations. Market share outputs from conjoint simulators assume a closed competitive set and equal awareness of all options. Real markets do not work that way. Treat simulation outputs as directional signals, not sales forecasts.
- Using MaxDiff for pricing questions. MaxDiff cannot estimate price sensitivity or simulate market shares. Researchers who use it for these purposes get results that feel authoritative but are structurally invalid.
Pilot testing addresses most of these issues before they contaminate your full dataset. Neglecting a pilot risks invalid results and wasted resources. A two-day pilot is cheap insurance against a six-figure data collection mistake.
Generative AI tools can help draft attribute descriptions and create visual stimuli for conjoint tasks. They speed up the design process. But AI cannot replace the researcher’s judgment on attribute selection, level realism, or experimental logic. Letting AI make those calls produces studies that look polished and produce unreliable data.
Pro Tip: After your conjoint study closes, run a short qualitative follow-up with 8–10 respondents. Ask them to explain their choices in their own words. Their language will tell you things the utility scores cannot.
Key takeaways
Conjoint research produces reliable preference data only when the method, design, and sample size are matched to the specific business question being answered.
| Point | Details |
|---|---|
| Match method to objective | Use CBC for pricing and share simulation; use MaxDiff only for feature ranking. |
| Limit attribute count | Cap studies at 4–6 attributes to preserve data quality and reduce fatigue. |
| Size your sample correctly | Plan for 500–1,000 respondents when Hierarchical Bayes estimation is required. |
| Always pilot first | Run a small pilot to catch design flaws before full data collection begins. |
| Treat simulations as directional | Market share outputs are signals, not sales forecasts; interpret them accordingly. |
Why conjoint still earns its place at the table
I have seen product teams spend months debating which features to prioritize, running focus groups, and reviewing customer feedback, only to launch something the market does not want. Conjoint research cuts through that noise. It does not ask consumers what they want. It shows you what they choose when they cannot have everything.
The method has been around since the 1970s, and that longevity is not nostalgia. It is because the core logic is sound. People make trade-offs. Conjoint measures those trade-offs. Everything else is commentary.
What I find underappreciated in 2026 is how much the interpretation step still trips up smart researchers. The math is easier than ever with modern HB estimation software. The hard part is translating utility scores into a product decision your leadership team will act on. That requires knowing your market, your competitive set, and your business constraints. No algorithm provides that context. You do.
The AI-enhanced conjoint tools entering the market are genuinely useful for stimulus creation and design iteration. I use them. But I have also watched researchers hand over attribute selection to a language model and get back a study that was technically complete and strategically useless. The tool does not know your category. You do. Keep that responsibility where it belongs.
My honest advice: invest more time in design than in analysis. A well-designed study with modest analysis produces better decisions than a poorly designed study with sophisticated modeling. The data you collect is the ceiling on everything that follows.
Veridata Insights and your next conjoint project
Veridata Insights handles conjoint research from design through delivery, including consultation, questionnaire review, programming, data collection, and reporting. Whether you need a focused CBC study for a pricing decision or a full segmentation project using Hierarchical Bayes, the team at Veridata Insights builds studies that match your objective and your timeline. There are no project minimums, and the team is available seven days a week. If you are ready to get preference data you can actually act on, reach out to Veridata Insights to talk through your research goals. Quality matters more than size, and we know how to deliver both.
FAQ
What is conjoint research used for?
Conjoint research measures how consumers value different product features by analyzing the trade-offs they make during choice tasks. Brand managers and product developers use it to guide pricing, feature prioritization, and product configuration decisions.
How many attributes should a conjoint study include?
The recommended range is 4–6 attributes with 2–5 levels each. Exceeding this degrades data quality through respondent fatigue and satisficing behavior.
What sample size does conjoint analysis require?
Sample size depends on the analysis method. Aggregate utility estimation needs 200–300 respondents, Hierarchical Bayes requires 500–1,000, and market share prediction may need up to 1,500.
Can MaxDiff replace Choice-Based Conjoint?
No. MaxDiff ranks attribute importance reliably but cannot estimate price sensitivity or simulate market shares. Those questions require Choice-Based Conjoint.
How does Veridata Insights support conjoint studies?
Veridata Insights provides end-to-end support including study design, programming, data collection, and advanced analytics for conjoint projects across B2B, B2C, and healthcare audiences, with no minimum project size.