Survey sampling is the process of selecting a subset of individuals from a larger population to estimate characteristics of the whole group. Every sampling approach falls into one of two families: probability sampling, where every member of the population has a known, non-zero chance of selection (enabling margin-of-error calculations), and non-probability sampling, where selection is nonrandom and driven by practicality or purpose.
Quick guide to choosing a family:
- Use probability sampling when you need statistically defensible estimates, margin-of-error reporting, or results that generalize to a defined population.
- Use non-probability sampling when speed, cost, or population accessibility make probability methods infeasible, such as in exploratory research, B2B studies, or hard-to-reach audience recruitment.
Table of Contents
- Why survey sampling matters: populations, frames, and the census alternative
- Probability sampling methods: how each one works and when to use it
- Non-probability sampling methods: when they work and when they don’t
- How to choose a sampling method: a decision checklist
- Sample-size basics: margin of error, confidence levels, and design effects
- Sampling frames, recruitment modes, and handling nonresponse
- Sources of error: what goes wrong and how to prevent it
- Three worked examples: national panel, B2B hard-to-reach, and clustered household survey
- How Veridata Insights implements sampling in practice
- Key Takeaways
- Veridata Insights handles the hard parts of sampling for you
- Authoritative resources for further reading
Why survey sampling matters: populations, frames, and the census alternative
Before you design a single question, you need four terms locked down.
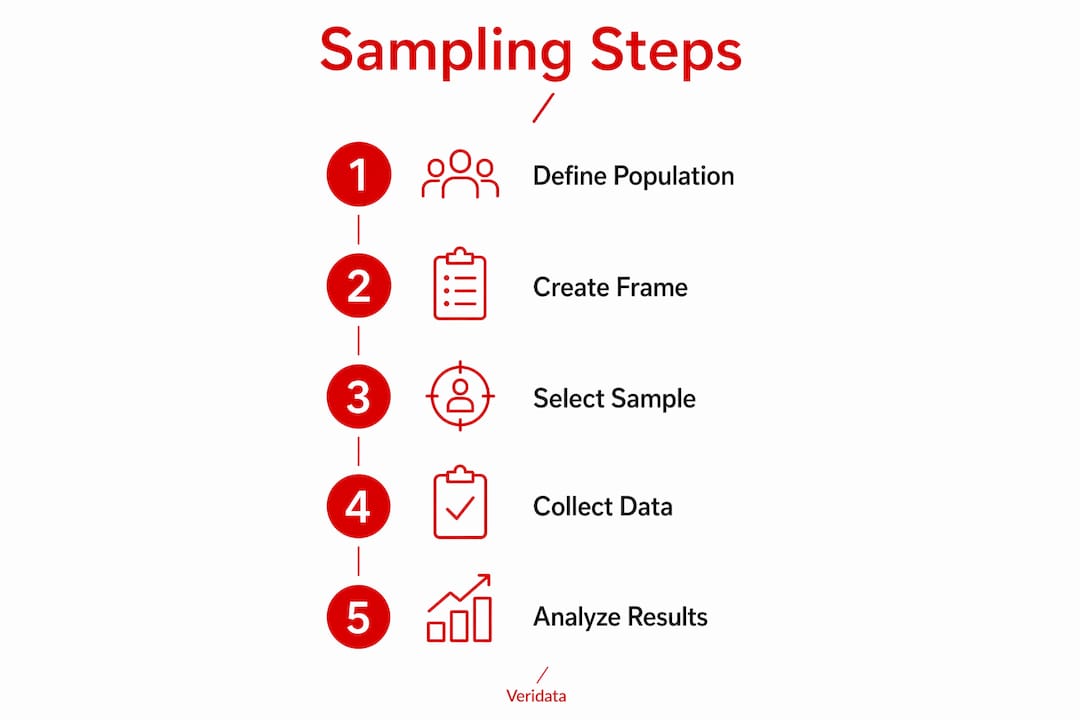
A population is every unit you want to draw conclusions about — all U.S. adults, all CFOs at mid-market manufacturing firms, or all patients discharged from a specific hospital network. A sample is the subset you actually study. The sampling frame is the list or mechanism from which you draw that sample (a voter registration file, a CRM export, a panel database). A sampling unit is the individual element selected — a person, a household, or a business location.
One more distinction that trips up even experienced practitioners: a survey is the full research process, from design through data collection to analysis. A questionnaire is just the instrument, the list of questions itself. Conflating the two leads to poor project scoping and inaccurate budgets.
Why not just survey everyone? A census covers the entire population, which eliminates sampling error but multiplies cost and time. Sample surveys are generally cheaper and faster than censuses, and for most research questions, a well-designed sample delivers estimates accurate enough to act on. The tradeoff is sampling error, the gap between your sample estimate and the true population value, which probability methods let you quantify and control.
Think of the sampling frame as a map of your population. If the map has blank spots (undercoverage) or duplicates (overcoverage), your estimates will be biased no matter how large your sample is. A classic illustration: a frame built from landline phone records systematically excludes mobile-only households, skewing any estimate that correlates with age or income.
Worked example callout: Imagine you want to estimate the share of U.S. small-business owners who plan to hire in the next quarter. Your population is all U.S. small-business owners. Your sampling frame might be a commercial business database. Your sampling unit is one business owner per firm. The gap between that database and the true population (new businesses, sole proprietors not yet listed) is your coverage risk.

Probability sampling methods: how each one works and when to use it
Probability sampling means every unit in the frame has a calculable, non-zero chance of selection. That property is what makes margin-of-error statements valid and what allows you to generalize findings to the broader population with confidence.

| Method | How it works | Best use case | Main risk |
|---|---|---|---|
| Simple random sampling (SRS) | Every unit drawn with equal probability, typically via a random number generator | Small, accessible frames; baseline for other methods | Requires a complete frame; can miss rare subgroups |
| Systematic sampling | Select every kth unit after a random start | Large ordered lists (membership rolls, patient records) | Periodicity bias if the list has a repeating pattern |
| Stratified sampling | Divide population into non-overlapping strata, then sample within each | When subgroup estimates matter (region, age, industry) | Requires stratum-level auxiliary data |
| Cluster sampling | Divide population into clusters, randomly select clusters, then survey all or a sample within each | Geographically dispersed populations; cost-driven designs | Design effect inflates variance; requires larger total n |
| Probability-proportional-to-size (PPS) | Larger clusters have a higher selection probability | Multi-stage designs with unequal cluster sizes | More complex weighting at analysis |
| Multi-stage sampling | Multiple rounds of cluster or stratified selection | National household surveys; large-scale field studies | Compounding design effects across stages |
Worked example: cluster sampling for a household survey
Suppose you need to survey 800 U.S. households across five states about energy usage.
- Stage 1: Define clusters as census tracts. Randomly select 40 tracts using PPS (larger tracts have higher selection probability).
- Stage 2: Within each selected tract, randomly select 20 households from address-based sampling (ABS) records.
- Result: 40 × 20 = 800 target interviews.
- Design effect: Because households within the same tract share characteristics (income, housing type), your effective sample size is smaller than 800. A typical design effect (DEFF) for this kind of study runs between 1.5 and 2.0, meaning your 800 interviews carry the precision of roughly 400–530 simple random sample interviews. You must account for this when calculating margins of error.
Pro Tip: Always use a random start when applying systematic sampling. If your list is sorted by geography or company size, a non-random start can introduce subtle bias that is nearly impossible to detect after the fact.
Non-probability sampling methods: when they work and when they don’t
Non-probability methods skip the randomization step. Selection depends on availability, judgment, or referral. That makes them faster and cheaper, but it also means you cannot calculate a true margin of error or claim statistical representativeness of a defined population.
| Method | How it works | Typical use case |
|---|---|---|
| Convenience sampling | Recruit whoever is easiest to reach | Exploratory pilots, student research, initial concept testing |
| Quota sampling | Set targets by subgroup (age, gender, industry), fill slots by any means | Online panels, omnibus studies, B2B research |
| Purposive (judgmental) | Researcher hand-picks participants based on expertise or fit | Expert interviews, policy research, rare condition studies |
| Snowball (referral) | Participants recruit peers from their own networks | Hard-to-reach groups: rare diseases, niche B2B roles, underground communities |
Industry practitioners commonly prefer non-probability methods for B2B or hard-to-reach audiences where probability sampling is simply not feasible. A quota sample of 200 IT security directors is far more achievable than a probability draw from a frame that does not publicly exist.
The key inferential limit: Non-probability samples cannot support margin-of-error claims tied to a defined population. You can describe your sample, report frequencies, and identify patterns, but you cannot say “this finding is accurate to ±3 points among all U.S. IT directors” without a probability-based design. Treat non-probability results as directional evidence, not population estimates, unless you apply rigorous post-stratification weighting against known benchmarks.
Validation checklist for non-probability samples:
- Compare sample demographics to known population benchmarks (Census data, industry association figures).
- Check for quota cell completion rates; underfilled cells signal recruitment bias.
- Run a sensitivity analysis: how much would your key finding shift if the unrepresented segment held a different view?
- Document the recruitment method and its limitations in any deliverable.
B2B scenario: A pharmaceutical company needs 75 completed interviews with hospital pharmacy directors at facilities with 300+ beds. No probability frame exists. The right approach is purposive recruitment via a verified healthcare panel, with quota controls on facility size and region, plus verification calls to confirm role and bed count. Snowball referrals from initial completes can fill hard-to-reach specialties. Recruiting hard-to-reach audiences like this requires both a smart method choice and rigorous respondent verification.
How to choose a sampling method: a decision checklist
Method selection is not a theoretical exercise. It comes down to five practical questions.
- What is your primary research objective? Descriptive population estimates require probability methods. Exploratory hypothesis generation can tolerate non-probability approaches.
- How much precision do you need? If you need to report a margin of error or make subgroup comparisons, probability sampling is non-negotiable.
- How accessible is your target population? A complete, accurate sampling frame is the prerequisite for probability sampling. If no frame exists, non-probability is often your only option.
- What is your timeline and budget? Probability designs, especially multi-stage ones, cost more and take longer. Non-probability panels can field in days.
- Are there ethical constraints? Vulnerable populations (minors, patients, incarcerated individuals) require additional protections: informed consent, IRB approval, and data minimization practices. Never collect more personal data than your research objective requires.
Before you finalize your method, ask these questions:
- Does a reliable sampling frame exist, and when was it last updated?
- Will you need subgroup-level estimates? If so, are those subgroups large enough in your proposed sample to support separate analysis?
- What survey mode will you use (online, phone, in-person, mail)? Mode affects who responds and how, which shapes your frame and recruitment strategy.
- Have you planned for nonresponse? A 30% response rate on a probability design is very different from a 30% completion rate on an online panel.
Red flags that signal likely bias:
- Your sampling frame covers less than 80% of your target population.
- Quota cells are filled by a single recruiter or channel.
- Your “random” sample was drawn from a convenience list (website visitors, social media followers).
- Nonresponse rates differ sharply across key subgroups.
- You have no plan to weight or adjust the data post-collection.
Sample-size basics: margin of error, confidence levels, and design effects
The standard formula for a simple random sample size is:
n = (z² × p × (1 − p)) / e²
Where:
- z = z-score for your desired confidence level (1.96 for 95%, 2.— for 99%)
- p = estimated proportion of the population with the characteristic of interest (use 0.5 if unknown, which maximizes required sample size)
- e = desired margin of error (0.05 for ±5 percentage points)
Worked example 1 (simple random sample):
You want to estimate the share of U.S. adults who use a particular app, with 95% confidence and ±5% margin of error.
n = (1.96² × 0.5 × 0.5) / 0.05² = (3.8416 × 0.25) / 0.0025 = 0.9604 / 0.0025 = 384 respondents
For large populations (over 100,000), the finite population correction has minimal effect. For smaller populations, apply: n_adjusted = n / (1 + (n − 1) / N)
Worked example 2 (cluster design with design effect):
Your cluster design has a DEFF of 1.8. You need the same ±5% precision.
Adjusted n = 384 × 1.8 = 692 respondents
That extra 308 interviews is the cost of clustering. Ignoring the design effect and reporting a ±5% margin on 384 cluster-sampled interviews is a common and consequential mistake.
Balancing precision and resources: Sample-size tradeoffs involve margin of error, confidence level, population size, and resource constraints. Gains in precision diminish sharply as sample size grows. Doubling your sample cuts your margin of error by only about 30%, not 50%.
| Scenario | Confidence level | Margin of error | Minimum n (SRS) |
|---|---|---|---|
| National consumer poll | 95% | ±5% | 384 |
| National consumer poll | 95% | ±3% | 1,067 |
| Subgroup analysis (n ≥ 100 per cell) | 95% | ±10% | 100 per subgroup |
| B2B niche audience | 20–40% | ±7% | — |
| Cluster design (DEFF = 1.5) | 95% | ±5% | — |
Subgroup rule of thumb: Plan for at least 100 completed interviews per subgroup you intend to analyze separately. Anything below 50 per cell produces estimates too unstable to report with confidence.
Sampling frames, recruitment modes, and handling nonresponse
A sampling frame is only as good as its coverage of the target population. A poor frame leads to bias regardless of sample size, and that bias cannot be fixed after data collection. Before fieldwork begins, validate your frame against auxiliary data: compare frame counts by region, industry, or demographic against Census figures, trade association data, or administrative records.
Response rates by mode (typical ranges):
| Mode | Typical response rate range | Key tradeoff |
|---|---|---|
| In-person (face-to-face) | 20–40% | Highest quality; highest cost and time |
| 20–40% | Low cost; slow; literacy and address accuracy issues | |
| Phone (RDD/landline) | 10–20% | Declining coverage; cell-phone-only households excluded from RDD |
| Online (probability panel) | 20–40% | Fast; cost-effective; coverage gaps for offline populations |
| Online (open/river sample) | Varies widely | Convenience-based; nonresponse bias difficult to measure |
Nonresponse bias arises when people who do not respond differ systematically from those who do. A 20% response rate is not automatically disqualifying, but it demands a nonresponse analysis. Compare early versus late responders, or responders versus known non-responders on any available auxiliary variables.
Weighting and post-stratification basics:
When your achieved sample does not match the target population on key variables (age, gender, region, industry size), you apply weights. The simplest approach is post-stratification: divide the population into cells defined by the weighting variables, calculate the population proportion in each cell, and assign each respondent a weight equal to the population proportion divided by the sample proportion in that cell. The Horvitz-Thompson estimator generalizes this to unequal selection probabilities across the full design.
Recruitment best practices:
- Use multiple contact attempts (at least three for phone and mail modes).
- Personalize outreach where possible; named invitations outperform generic blasts.
- Offer appropriate incentives, but calibrate them to avoid attracting only incentive-driven respondents.
- Monitor quota cell fill rates daily during fieldwork and adjust recruitment channels as needed.
- Sample recruitment tactics like these directly affect the representativeness of your final dataset.
Sources of error: what goes wrong and how to prevent it
Sampling error is the natural variation between your sample estimate and the true population value. It shrinks as sample size grows and can be quantified in probability designs. Every other error type falls under the broader category of non-sampling error, and those are often harder to detect and impossible to fix after the fact.
The most frequent project failure is a flawed sampling frame. Verify frame coverage against auxiliary data and check for duplications or systematic omissions before launching fieldwork. A large, carefully randomized sample drawn from a bad frame will still produce biased results.
Major error sources and mitigations:
| Error type | How it enters | Mitigation |
|---|---|---|
| Coverage bias | Frame excludes part of the population | Validate frame against auxiliary data; use multiple frames |
| Selection bias | Nonrandom or self-selected recruitment | Use probability methods; document and weight non-probability designs |
| Measurement error | Poorly worded or leading questions | Pretest the questionnaire; use cognitive interviews |
| Nonresponse bias | Systematic differences between responders and non-responders | Monitor response rates by subgroup; apply nonresponse weighting |
| Processing error | Data entry, coding, or cleaning mistakes | Double-entry verification; automated range checks; codebook audits |
| Order effects | Earlier questions prime responses to later ones | Randomize question and option order; use split-form experiments |
Pew Research Center recommends pilot testing, cognitive interviews, and randomized question-form experiments to detect wording and order effects before full launch. A questionnaire that has not been pretested is a liability, not an instrument.
Pro Tip: Run a cognitive pretest with 5–10 members of your target population before finalizing any questionnaire. Ask them to think aloud as they answer. You will almost always find at least one question that means something different to respondents than it does to you, and catching that before launch costs far less than rerunning fieldwork.
Three worked examples: national panel, B2B hard-to-reach, and clustered household survey
Example 1: National online panel study
Objective: Measure U.S. consumer attitudes toward electric vehicles among adults 18–65.
- Method: Stratified quota sampling via a probability-based online panel.
- Sample size: 1,067 completes for ±3% margin of error at 95% confidence.
- Stratification variables: Age (four bands), gender, region (four Census regions), household income (three bands).
- Weighting plan: Post-stratify to Census Current Population Survey benchmarks on age, gender, region, and education.
- Timeline: 5–7 business days for fieldwork; 2–3 days for data processing and weighting.
- Cost drivers: Panel access fees, programming, data processing, and reporting.
Example 2: B2B hard-to-reach audience
Objective: Survey 100 supply chain directors at U.S. manufacturers with 500+ employees.
- Method: Purposive recruitment via a verified B2B panel, with quota controls on company size and industry sector (NAICS codes). Snowball referrals used to fill underrepresented sectors.
- Validation benchmarks: Role verification by job title and company size; screen-out rate tracked; duplicate IP and device checks applied.
- Timeline: 3–4 weeks for recruitment and fieldwork given low incidence.
- Cost drivers: Incidence rate (typically under 5% of general panel), verification calls, incentive levels for senior respondents.
Example 3: Multi-stage clustered household survey
Objective: Estimate food insecurity rates across rural counties in three Midwestern states.
- Stage 1: Stratify counties by population density. Randomly select 30 counties using PPS.
- Stage 2: Within each county, randomly select census tracts from address-based sampling records.
- Stage 3: Within each tract, randomly select 15 households. One adult per household is interviewed.
- Design effect: Estimated DEFF of 1.7 based on expected within-cluster homogeneity. Target n = 384 × 1.7 = 653 completed interviews.
- Timeline: Frame construction (2 weeks), fieldwork (4–6 weeks), data processing and weighting (2 weeks).
- Cost drivers: Interviewer travel, address verification, multi-stage coordination.
Implementation checklist (applies across all three examples):
- Finalize sampling frame and validate coverage before recruitment begins.
- Lock quota targets and get sign-off before fieldwork opens.
- Set daily monitoring checkpoints for response rates and quota cell fill.
- Pretest the questionnaire with 5–10 target respondents.
- Document all weighting variables and post-stratification targets before analysis.
- Archive the final weighted dataset and codebook with the deliverable.
How Veridata Insights implements sampling in practice
At Veridata Insights, every project starts with a scoping conversation that pins down the research objective, the target population, the required precision, and the timeline. From there, the process is methodical.
Process flow:
- Frame validation: We audit the proposed sampling frame against auxiliary data (Census benchmarks, industry databases, client CRM records) before a single invite goes out.
- Method selection and quota design: We recommend the sampling approach based on population accessibility, precision requirements, and budget, then set quota targets with built-in overage to protect against attrition.
- Recruitment and monitoring: Fieldwork is monitored daily. Response rates, quota cell fill, and data quality flags (speeding, straightlining, duplicate devices) are reviewed in real time.
- Weighting and adjustment: Post-stratification weights are applied to align the achieved sample with population benchmarks. We document every weighting decision.
- Delivery: Clean, weighted data with a full codebook, methodology report, and data visualization are delivered per the agreed timeline.
Quality control is not a final step. It runs throughout the entire project. Frame audits happen before launch. Speeder and straightliner checks run during fieldwork. Verification calls confirm respondent eligibility for B2B and healthcare studies. Reweighting is validated against multiple benchmark sources before the dataset is closed.
QC checklist used in production:
| Check | When applied | Action if flagged |
|---|---|---|
| Frame coverage audit | Pre-launch | Supplement or replace frame |
| Quota cell monitoring | Daily during fieldwork | Adjust recruitment channel or incentive |
| Speeder detection (< 1/3 median LOI) | Real-time | Remove and replace |
| Straightlining detection | Real-time | Remove and replace |
| Duplicate device/IP check | Real-time | Flag for review; remove confirmed duplicates |
| Verification call (B2B/healthcare) | Post-complete | Disqualify unverified respondents |
| Post-stratification weight check | Post-fieldwork | Reweight if cell deviation exceeds threshold |
Anonymized case example: A pharmaceutical client needed 80 completed interviews with oncology nurses at community cancer centers. Initial recruitment via a general healthcare panel returned a high proportion of hospital-based nurses, skewing the sample toward larger institutions. Veridata Insights identified the coverage gap during daily quota monitoring, shifted recruitment to a specialized oncology network, and applied facility-type quotas. The final sample matched the target population profile on facility size and practice setting, preventing a systematic bias that would have made the findings unrepresentative of the community-center segment the client needed to understand.
Key Takeaways
Probability sampling is the only method that supports valid margin-of-error reporting, but non-probability methods remain the practical choice for B2B, hard-to-reach, and exploratory research when no reliable frame exists.
| Point | Details |
|---|---|
| Choose your sampling family first | Probability sampling enables margin-of-error claims; non-probability is faster but requires validation against benchmarks. |
| Validate your frame before launch | A flawed sampling frame produces biased results regardless of sample size; check coverage against auxiliary data every time. |
| Account for design effects | Cluster designs require a larger total sample; multiply your SRS target by the design effect before setting quotas. |
| Pretest every questionnaire | Cognitive pretesting with 5–10 target respondents catches measurement and order effects before they corrupt your data. |
| Veridata Insights manages the full process | From frame validation and recruitment to weighting and reporting, Veridata Insights handles sampling and survey execution end to end. |
Veridata Insights handles the hard parts of sampling for you
Designing a sound sample is one thing. Executing it, monitoring it in real time, and delivering clean, weighted data is another challenge entirely. Veridata Insights offers methodology consultation, sampling frame validation, recruitment for B2B, healthcare, and hard-to-reach audiences, questionnaire review, survey programming, data processing, weighting, and full reporting. No project minimums. Seven days a week. Whether you need a 100-person B2B study or a multi-stage national survey, we scope the right approach and execute it with the quality controls that protect your findings.
Ready to get your sampling design right from the start? Talk to our team about your next project, or explore how we deliver transformative insights for research teams and consulting firms.
Authoritative resources for further reading
These sources provide technical depth on the methods covered above. Each is linked to the section it supports most directly.
- Stats NZ: A Guide to Good Survey Design, Sixth Edition — Covers survey planning, sampling frame issues, sample-size determination, nonresponse, and weighting. The most comprehensive non-technical reference for practitioners. Supports sections on definitions, sample size, frame validation, and bias.
- Pew Research Center: Writing Survey Questions — Detailed guidance on question wording, order effects, cognitive testing, and split-form experiments. Directly supports the bias and pretesting sections.
- StatTrek: Sampling Methods — Clear, concise overview of probability and non-probability methods with definitions and examples. Good entry point for students and early-career researchers.
- AIFS: How to Write a Survey Questionnaire for Evaluation — Explains the survey-vs.-questionnaire distinction, question types, and piloting. Supports the definitions and measurement-error sections.
- Eurostat: Survey Sampling Reference Guidelines — Technical reference for stratified, cluster, PPS, and multi-stage designs with worked examples. Supports the probability methods and design-effect sections.
- Harvard: Survey Sampling (Imai) — Academic treatment of design-based and model-based inference, weighting (Horvitz-Thompson), and variance estimation. Supports the sample-size and weighting sections.
- Wikipedia: Survey Sampling — Useful summary of probability and non-probability distinctions, common bias types, and specialized techniques (address-based sampling, RDD, area probability). Good orientation reference.