Choose longitudinal when you need to observe change, measure incidence, or establish temporal order. Choose cross-sectional when you need a fast, affordable prevalence estimate. That’s the short version. The longer version depends on your research question, your budget, and how much causal weight your findings need to carry.
Two quick exceptions worth flagging before you read further:
- Repeated cross-sections can track population-level trends over time without following the same individuals, making them a practical middle path when panel tracking is too costly.
- Hybrid designs (a cross-sectional baseline followed by targeted follow-up waves) often give applied researchers the best of both worlds when resources are tight.
Use the checklist in Section 8 to confirm your choice once you’ve worked through the trade-offs below.
Key Takeaways
The bottom-line rule: match your design to your inference goal — cross-sectional for prevalence and description, longitudinal for change, incidence, and causal ordering.
| Point | Details |
|---|---|
| Design choice drives inference | Cross-sectional answers “how many now?”; longitudinal answers “how does it change and why?” |
| Causality requires temporal ordering | Only longitudinal designs observe exposure before outcome, the minimum condition for causal claims. |
| Attrition is the core longitudinal risk | Differential dropout biases results; adjust with multiple imputation or inverse-probability weighting. |
| Repeated cross-sections fill the middle | Independent samples at each wave track population trends without the cost of individual tracking. |
| Veridata Insights fits any design | From cross-sectional recruitment to multi-wave panel management, Veridata Insights handles design consultation, data collection, and analytics for any scope. |
Table of Contents
- What do “longitudinal” and “cross-sectional” actually mean?
- How do the two designs compare across the dimensions that matter?
- What variants of each design should you know about?
- What are the real advantages and limitations of each design?
- What analytic and design choices does each approach require?
- How do timeline, cost, and ethics shape your decision?
- How do you decide which design fits your study?
- Real U.S. studies that show each design in action
- Veridata Insights brings your study design to life
- Sources
What do “longitudinal” and “cross-sectional” actually mean?
These two terms describe the most fundamental fork in observational research design. Getting them straight early saves a lot of confusion later.
A cross-sectional study collects data from a sample at a single point in time. Think of it as a photograph: you see who has what condition, behavior, or characteristic right now, but you can’t tell what came first. Cross-sectional data cannot by itself establish causation because it lacks temporal precedence.
A longitudinal study follows the same units (people, organizations, communities) across multiple time points. The repeated measurement is what makes it longitudinal. Within that broad category, you’ll encounter several variants:
- Prospective cohort: Participants are enrolled and followed forward in time from a defined starting point.
- Retrospective cohort: Researchers look backward, reconstructing exposure and outcome histories from existing records.
- Panel study: A fixed sample is surveyed repeatedly, common in social science and economics.
- Intensive longitudinal data (ILD): Many measurements per person over a short window, often via ecological momentary assessment or wearable sensors.
Two distinctions that trip people up regularly:
Repeated cross-section vs. panel. A repeated cross-section surveys a fresh random sample at each wave. A panel surveys the same individuals each time. Both produce time-series data at the population level, but only the panel lets you measure within-person change.
Prospective vs. retrospective. Prospective designs measure exposures before outcomes occur, which reduces recall bias. Retrospective designs are faster and cheaper but depend on the accuracy of past records or memory.
A few technical terms you’ll see throughout this article: attrition (participants dropping out over time), temporality (whether cause precedes effect), confounding (a third variable that distorts the apparent relationship), and STROBE (the Strengthening the Reporting of Observational Studies in Epidemiology checklist, the standard reporting framework for cohort and cross-sectional studies).
How do the two designs compare across the dimensions that matter?
| Dimension | Cross-Sectional | Longitudinal (Cohort/Panel) |
|---|---|---|
| Primary question | What is the prevalence or distribution right now? | How does X change over time, or does X cause Y? |
| Temporal scope | Single time point | Multiple waves over months or years |
| Causal inference | Weak — no temporal ordering | Stronger — sequence can be observed |
| Key biases | Confounding, recall bias, cohort/period effects | Attrition, repeated-measure effects, historical confounding |
| Sample requirements | Large cross-section; simpler frame | Same units tracked; needs retention strategy |
| Cost and timeline | Lower cost; weeks to months | Higher cost; months to decades |
| Typical analyses | Logistic/linear regression, chi-square, prevalence ratios | Mixed-effects models, growth curves, Cox regression, fixed-effects |
Two trade-offs stand out above the rest.
Causality vs. cost. Longitudinal designs give you temporal ordering, which is the closest observational research gets to causal evidence. But that ordering comes at a price: multi-wave data collection, participant tracking infrastructure, and years of funding commitment. Cross-sectional work is dramatically cheaper and faster, which is why it dominates public health surveillance and policy snapshots.
Attrition vs. recall bias. Longitudinal studies lose participants over time, and dropout is rarely random. People who leave a study often differ systematically from those who stay, which can bias results. Cross-sectional studies sidestep attrition but introduce recall bias when they ask participants to report past exposures or behaviors from memory.
Pro Tip: The word “cohort” means different things in different fields. In epidemiology, a cohort is a group followed prospectively over time. In social science and economics, “panel” is the more common term for the same design. When reading across disciplines, check whether the author means a tracked group or just a birth-year grouping before assuming the design type.
What variants of each design should you know about?
The broad categories of longitudinal and cross-sectional research each contain sub-types with meaningfully different uses.
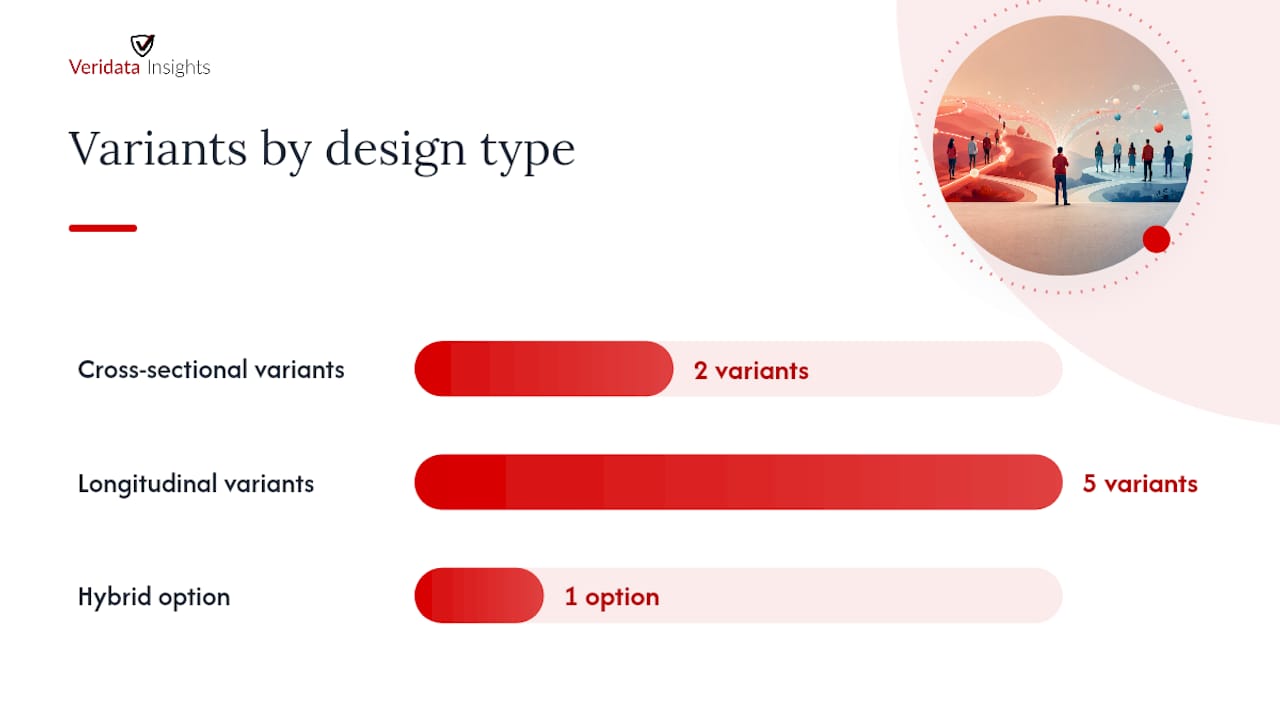
Cross-sectional variants:
- Single cross-section: One sample, one time point. Used for prevalence estimation, needs assessments, and baseline descriptions. The National Health and Nutrition Examination Survey (NHANES) uses this structure to estimate the prevalence of health conditions across the U.S. population.
- Repeated cross-section: Independent samples drawn at multiple time points from the same population. Repeated cross-section surveys increase statistical power for population-level trend estimation and are a practical alternative to panels when tracking the same individuals is impractical. They cannot, however, measure within-person change. Gallup’s presidential approval polling and the Bureau of Labor Statistics’ monthly jobs report follow this structure.
Longitudinal variants:
- Prospective cohort: The Framingham Heart Study is the canonical U.S. example. Enrolled in 1948, participants have been followed across generations to identify cardiovascular risk factors. The design enabled causal inference about smoking, blood pressure, and cholesterol that a single cross-section never could.
- Retrospective cohort: Researchers identify a group that experienced an exposure in the past and trace outcomes forward using records. Faster than prospective work, but dependent on record quality.
- Panel study: The Panel Study of Income Dynamics (PSID) at the University of Michigan has tracked U.S. families since 1968, enabling research on income mobility, wealth accumulation, and intergenerational poverty.
- Intensive longitudinal data (ILD): Dozens or hundreds of measurements per person, often daily or multiple times daily. Used in psychology, health behavior, and clinical research to capture intraday variability. The data structure here follows a persons × occasions × variables framework that requires specialized multilevel or time-series analytic approaches.
- N=1 time series: A single participant measured repeatedly. Common in clinical case studies and single-subject experimental designs.
When hybrid designs make sense: A cross-sectional baseline followed by one or two targeted follow-up waves is often the most practical option for applied researchers with limited budgets. You get prevalence data immediately and can assess change for a subset of outcomes without committing to a full multi-wave cohort. Life-course research guidance explicitly supports this approach when cost is a constraint.
What are the real advantages and limitations of each design?
Cross-sectional strengths
Speed and cost are the obvious ones. A well-designed cross-sectional survey can go from questionnaire to clean data in weeks. Large samples are feasible because you’re only collecting data once. Prevalence estimation is the design’s natural strength: what share of the population has diabetes, holds a particular political opinion, or uses a given product right now? For policy snapshots and needs assessments, cross-sectional data is often exactly what’s needed.
Cross-sectional limitations
The core problem is temporal precedence. Without knowing which came first, exposure or outcome, you can’t make causal claims. Confounding is a persistent threat because unmeasured variables may explain the observed association. Cohort and period effects can distort findings when age, birth year, and historical moment are all tangled together in a single snapshot. And when you ask participants to recall past exposures, recall bias enters the picture.
Longitudinal strengths
Temporal ordering is the headline advantage. When you observe that exposure precedes outcome across multiple waves, you have a much stronger basis for causal inference than any cross-section can provide. Longitudinal designs also measure incidence (new cases arising over time) rather than just prevalence, which is critical for understanding disease onset, behavioral change, and developmental trajectories. Within-person analyses using fixed-effects models can control for all stable individual characteristics, observed or not.
Longitudinal limitations
Cost and time are the obvious barriers. Attrition is the subtler one. Participants drop out for reasons that often correlate with the outcome of interest: sicker people leave health studies, lower-income families leave economic panels. Cohort studies require explicit follow-up schedules and analytic methods that account for varying follow-up time, such as Cox proportional hazards models. Repeated measurement can also create practice effects, where participants respond differently simply because they’ve seen the questions before.
Preregistered analysis plans and STROBE-compliant reporting improve credibility for observational cohorts and reduce the risk that attrition or analytic flexibility undermines causal claims. — PMC, Research Design: Cohort Studies
What analytic and design choices does each approach require?
Sampling and sample size
Cross-sectional studies need samples large enough to estimate prevalence with acceptable precision. Clustered samples (schools, clinics, census tracts) require design-effect adjustments that inflate the effective sample size needed.
Timing and wave spacing
The interval between waves should match the process you’re studying. Measuring annual income monthly adds noise without insight. Measuring daily mood annually misses the variation entirely. Measurement reactivity (participants changing behavior because they know they’re being observed) and practice effects (familiarity with instruments inflating scores) both increase with wave frequency.
Missing data and attrition
Prevention is better than correction. Recruitment and retention strategies such as participant tracking systems, refreshed incentives, and mobile-friendly data collection materially reduce dropout. When attrition does occur, analytic adjustments include:
- Multiple imputation for data missing at random
- Inverse-probability weighting when dropout is related to observed covariates
- Sensitivity analyses (pattern-mixture models) to test how conclusions change under different missing-data assumptions
Analytic approaches
For cross-sectional data: logistic regression, linear regression, prevalence ratios, and chi-square tests are the workhorses. For longitudinal data, the choice depends on the outcome and question:
- Mixed-effects models for continuous outcomes with repeated measures
- Growth curve analysis to model individual trajectories over time
- Cox proportional hazards for time-to-event outcomes
- Fixed-effects regression for within-person change, controlling for all stable confounders
- Propensity score methods to reduce confounding in observational cohorts
Cohort study design guidance recommends pre-specifying assessment schedules and analytic techniques, including propensity matching and Cox models, to adjust for confounding and varying follow-up time.
Pro Tip: Before running your main models, run attrition balance checks: compare baseline characteristics of completers vs. dropouts. Then run wave-level descriptive comparisons to spot drift in sample composition. If dropout is substantial and differential, pattern-mixture models can show how sensitive your conclusions are to different assumptions about the missing data.
How do timeline, cost, and ethics shape your decision?
Timeline and cost drivers
A single-wave cross-sectional survey with a general population sample can realistically be designed, fielded, and analyzed in six to twelve weeks. A multi-wave longitudinal cohort with annual follow-ups over five years is a fundamentally different operational commitment: participant tracking infrastructure, wave-by-wave data management, and sustained funding across the full study period.
The cost difference is not marginal. Longitudinal work requires ongoing recruitment to replace attrited participants (in some designs), repeated data collection costs, and data management systems that link records across waves. For many applied research clients, the real choice is operational: whether the budget and timeline can support repeated contact and the data-management overhead of multi-wave work.
Recruitment and retention
The best practices for longitudinal retention include maintaining updated contact information across waves, offering meaningful incentives at each wave (not just at enrollment), using mobile-first survey platforms to reduce friction, and building a participant community that sustains engagement over time.
Ethical and regulatory considerations
Longitudinal studies carry ethical obligations that cross-sectional work does not. These include:
- Ongoing informed consent: Participants must be reconsented when new measures or data uses are added.
- Data retention policies: Multi-wave datasets linking sensitive information over years require robust security protocols and clear retention and destruction schedules.
- IRB considerations: Institutional Review Boards typically require longitudinal studies to address how participant welfare will be monitored across waves, not just at enrollment.
- Sensitive data protections: Studies tracking health, financial, or behavioral data over time face heightened obligations around data linkage and re-identification risk.
A cross-sectional project can be completed in weeks; a multi-wave cohort study may require years of sustained funding, participant tracking, and data management infrastructure before the primary research questions can be answered.
How do you decide which design fits your study?
Work through these questions in order.
- Is your primary goal to measure prevalence or describe a population at one point in time? If yes, cross-sectional is likely sufficient.
- Do you need to measure incidence (new cases or events arising over time)? If yes, you need a longitudinal design.
- Does your research question require establishing that exposure precedes outcome? If yes, longitudinal is required. Longitudinal designs are preferred when you must track change, measure incidence, or establish temporal order.
- How long is the causal window? If the effect unfolds over years, you need a long follow-up. If it’s days or weeks, a short intensive design may work.
- What resources and timeline are available? If funding covers only one data collection round, cross-sectional or repeated cross-section is the realistic option.
Feasibility checklist before committing to a longitudinal design:
- Sample frame is stable and participants can be re-contacted across waves
- Funding is secured for the full study period, not just wave one
- Expected attrition rate has been estimated and initial sample size adjusted accordingly
- IRB approval covers the full longitudinal protocol, including reconsent procedures
- Data management infrastructure exists to link records across waves
Decision heuristics:
- If X is prevalence or association at one time point, choose cross-sectional.
- If X is change, trajectory, or incidence, choose longitudinal.
- If X is population trend without individual tracking, choose repeated cross-section.
- If budget is limited but some change data is needed, consider a hybrid baseline + one follow-up wave.
Pro Tip: Before committing to a five-year cohort, pilot a short two-wave panel over three to six months. You’ll learn your actual attrition rate, identify measurement problems, and test your retention strategies before the full investment is on the line.
Real U.S. studies that show each design in action
Cross-sectional: NHANES
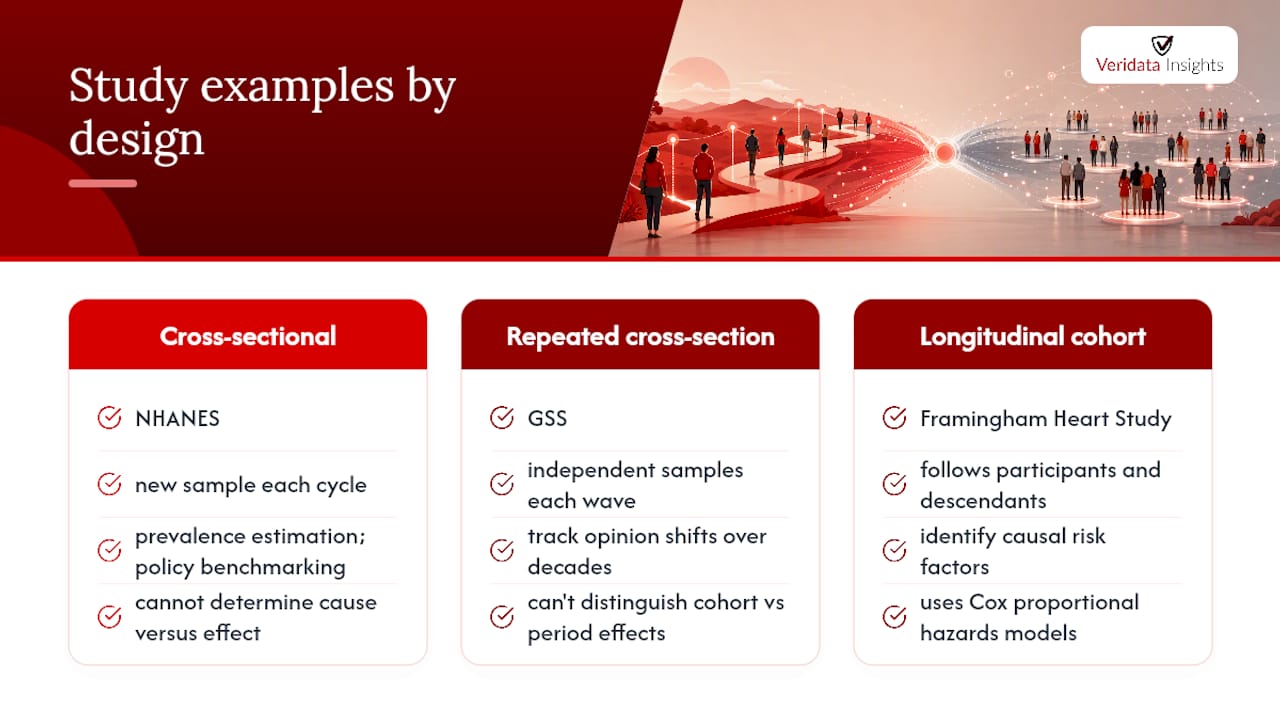
The National Health and Nutrition Examination Survey combines interviews and physical examinations to estimate the prevalence of health conditions and risk factors across the U.S. population. A new cross-sectional sample is drawn each cycle. The design is ideal for prevalence estimation and policy benchmarking but cannot tell you whether obesity caused hypertension or vice versa.
Repeated cross-section: General Social Survey (GSS)
The GSS has surveyed independent samples of U.S. adults since 1972, tracking attitudes on topics from race relations to trust in institutions. Each wave is a fresh sample, so you can see how American opinion has shifted over decades without tracking any individual. The trade-off: you can’t distinguish cohort effects from period effects without additional modeling.
Longitudinal cohort: Framingham Heart Study
Launched in 1948, Framingham enrolled residents of Framingham, Massachusetts, and has followed them and their descendants across generations. The prospective cohort design enabled researchers to identify smoking, high blood pressure, and elevated cholesterol as cardiovascular risk factors, causal claims that a cross-section could only have suggested. The study follows STROBE reporting standards and uses Cox proportional hazards models to account for varying follow-up time across participants.
For teams deciding between these designs, turning data into decisions requires matching the design to the inference you actually need, not just the data you can afford to collect.
Veridata Insights brings your study design to life
Choosing the right design is step one. Executing it well is where most studies succeed or fall short. Veridata Insights works with research teams at every stage: from methodology consultation and questionnaire design through data collection, processing, and reporting, for both single-wave cross-sectional projects and multi-wave longitudinal panels.
We specialize in recruiting hard-to-reach B2B, B2C, healthcare, and specialized audiences, the populations that make longitudinal retention genuinely difficult. No project minimums, seven days a week. Whether you need a fast cross-sectional snapshot or a sustained panel with wave-by-wave management, we build the research infrastructure around your question, not the other way around.
Ready to move from design decision to fielded study? Contact Veridata Insights to discuss your project scope.
Sources
- Cross-sectional data – Wikipedia
- Life-course research methods – NCBI Bookshelf
- Longitudinal study vs. cross-sectional study – SurveyCTO