The best speeder detection rules never rely on one number. Combine screen-level timing against median dwell times, add soft prompts before you delete anyone, and roll everything into a single inattention score that gets a human look before exclusion. This catches more low-quality data while protecting good respondents who just happen to read fast.
TL;DR:
- Combining screen-level timing with other quality indicators like straightlining and open-text plausibility improves detection of low-quality responses without falsely penalizing fast but attentive respondents.
- Setting timing thresholds based on median dwell times on common items, rather than total completion time, provides more accurate and adaptable speed checks.
- Implementing soft prompts when respondents answer too quickly can slow down speeders and enhance data quality without reducing completion rates.
- Using an inattention scoring system that weights multiple signals allows for more transparent and defensible respondent exclusions.
- Conducting pilot tests and calibrating thresholds before full fielding helps prevent inappropriate exclusions and ensures thresholds remain effective across different devices and survey versions.
Table of Contents
- Practical Speeder Detection Rules: A Prioritized Checklist
- How to Set Timing Thresholds Without Guessing
- Soft Interventions: Prompting and Commitment Before You Delete Anyone
- Building an Inattention Score That Keeps Exclusions Defensible
- How Veridata Insights Operationalizes Speeder Detection in Client Projects
- A Five-Step QA Decision Flow for After Fielding
- Get Speeder Detection Built Into Your Next Study
- Sources
- FAQ
Practical Speeder Detection Rules: A Prioritized Checklist
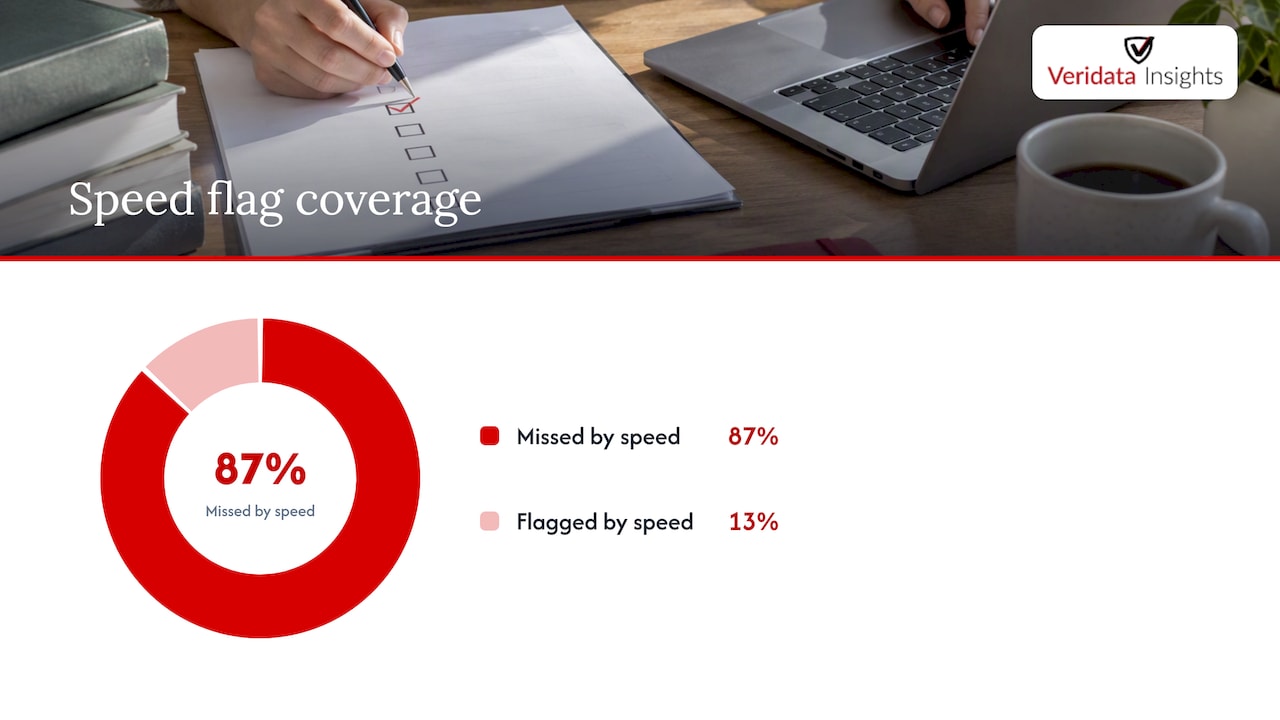
Most quality checks start and end with a single completion-time cutoff, and that is exactly the mistake to avoid. Speeding alone catches only a fraction of bad data: one Pew Research analysis found that while just 1.5% of respondents were flagged as speeders, roughly 87% of confirmed bogus respondents were never flagged by speed alone. Speed is one signal among several, not a verdict.
Here is the checklist we recommend running on every quantitative fielding:
- Collect screen-level timestamps and compute median dwell time on common-route items, since medians resist the outliers that skew averages.
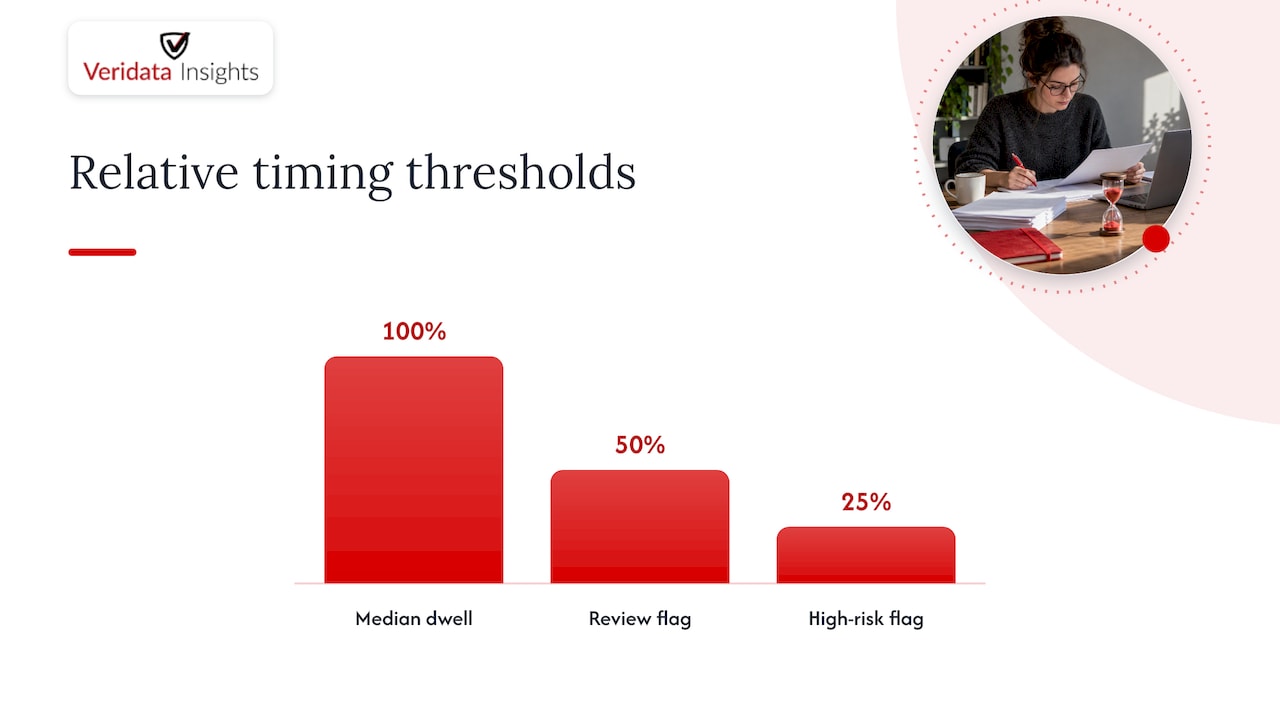
- Flag, don’t delete, anyone answering faster than half the median dwell time. Treat it as a review trigger, not a verdict.
- Layer in straightlining detection, attention checks, open-text plausibility scoring, duplicate IP or device patterns, and cross-question consistency checks.
- Sort flagged cases into severity bands: review, soft-intervene, or exclude.
- Pre-specify your replacement sampling rules before fielding starts, so nobody is making exclusion calls under deadline pressure.
- Document every rule and rerun your key estimates with and without excluded cases to check for sensitivity.
Question design also matters here. Shorter, clearer items naturally reduce legitimate variation in completion time, which makes your thresholds more reliable. Our survey design best practices guide covers the question-level fixes that reduce speeding before it starts.
Pro Tip: Run your severity bands on a pilot sample of 50 to 100 completes before applying them to the full field, so you catch threshold problems before they scale.
How to Set Timing Thresholds Without Guessing
Total completion time is a blunt instrument. It includes bathroom breaks, phone calls, and the minute someone spent finding their reading glasses. Screen-level timing, captured per page or per item, strips out those interruptions and shows you what actually happened while someone was answering. Methodologists who study data quality consistently recommend this granularity over aggregate completion time.
Here is a practical sequence for building your thresholds:
- Capture timestamps at the page or module level, not just at survey start and finish.
- Calculate the median dwell time for each screen across your live sample, restricted to common-route items so branching doesn’t distort the picture.
- Set a review flag at half the median and a high-risk flag at a quarter of the median.
- For text-heavy items, apply a milliseconds-per-word check rather than a flat time cutoff.
- Recalibrate thresholds periodically and log every change for reproducibility.
One experimental benchmark worth knowing: researchers testing interactive feedback prompts used a trigger of 350 milliseconds per word to flag speeding in real time, and it reliably reduced further speeding in the same session. That figure won’t fit every questionnaire, but it is a reasonable starting point for text-heavy items.
Device type matters too. Mobile respondents often show different natural pacing than desktop respondents on the same items, so a single cutoff across a heterogenous sample tends to misfire in both directions: flagging careful mobile users while missing speeders on desktop. Calibrate separately where sample size allows, and never treat a cutoff as permanent. What worked for last quarter’s tracker may not fit a redesigned questionnaire.
Soft Interventions: Prompting and Commitment Before You Delete Anyone
Deleting a respondent is a one-way decision. Prompting them is not, and the evidence favors trying that first. Across six web survey experiments, on-screen prompts triggered by speeding slowed subsequent response times and improved some accuracy measures, all without a noticeable rise in breakoffs. That is a rare combination: an intervention that helps data quality without costing you completes.
A few operational rules of thumb:
- Trigger a single, gentle prompt on the first speeding event rather than punishing every fast screen.
- Reserve repeated or firmer prompts for respondents who speed again after the first nudge.
- Pair prompts with a commitment item early in the survey (a simple “please answer thoughtfully” acknowledgment) to reinforce the norm without feeling like a scold.
- Track prompt effectiveness by device and wave, since effects can vary and fade over time.
- Escalate to manual review or exclusion only after a respondent ignores multiple prompts or the composite score crosses your exclude threshold.
Pro Tip: Word prompts as a helpful check-in, not a warning. “Just checking, did that answer come through as intended?” performs better than anything that sounds like an accusation.
Building an Inattention Score That Keeps Exclusions Defensible
A single flag rarely tells the whole story, which is why combining indicators into one score works better than any individual rule. NORC’s data cleaning guidance recommends exactly this: weigh speeding alongside straightlining, trap question failures, gibberish open-ends, and duplicate patterns rather than deleting on any one signal.
A workable weighting scheme:
- Minor flags (one missed attention check, mild speed deviation) contribute 1 point each.
- Major flags (gibberish open-text, duplicate device fingerprint with matching answers) contribute 3 points each.
- Sum the points into a single inattention score per respondent.
| Score band | Action |
|---|---|
| — | Keep, no action |
| 3 to 5 | Manual review |
| — | Exclude and replace |
This banding follows the thresholding logic NORC describes in its data cleaning research brief. Before finalizing exclusions, audit the excluded group against your sample’s demographics. Speeding correlates with age and education in ways that can quietly skew your data if you delete without checking, so run a quick comparison of excluded versus retained respondents on key demographics before you finalize the file. Document the scoring logic, the weights, and every override decision. That log is what makes your cleaning defensible to a client or an IRB months later, and it is what lets the next analyst reproduce your work instead of guessing at it.
How Veridata Insights Operationalizes Speeder Detection in Client Projects
We build these rules into the programming itself, not into a cleanup step after the fact. Our survey programming and consultation work includes setting up screen-level timing capture, coding soft-prompt logic, and calibrating thresholds against pilot data before a survey ever goes live.
On a typical engagement, that means questionnaire review with speeding risk in mind, threshold calibration against early field data, and post-collection quality audits that flag, score, and document every exclusion decision. When completes get excluded, our respondent recruitment team handles replacement sampling so your final numbers stay on target. We provide the consultation and the custom scripts. We do not promise a specific reduction in bad data on any given project, because that number depends on your sample, your questionnaire, and your audience.
A Five-Step QA Decision Flow for After Fielding
Once your survey closes, run this sequence before anyone touches the topline numbers:
- Compute per-screen medians across common-route items and flag anyone below your half-median or quarter-median thresholds.
- Calculate each respondent’s composite inattention score and sort into keep, review, or exclude bands.
- For future waves, apply soft interventions to reduce speeding at the source, and recontact panelists where that is feasible.
- Manually review every marginal or high-value completed survey and write down why you kept or dropped it.
- Replace excluded completes through your recruitment pipeline and rerun your key estimates to check for sensitivity to the cleaning decisions.
Our survey data cleaning QA checklist walks through this same sequence in more detail, and a spreadsheet-based version of steps 1 and 2 is doable in Excel using standard data cleaning functions if you are working with a smaller sample.
Get Speeder Detection Built Into Your Next Study
You don’t have to choose between fielding fast and fielding clean. Screen-level timing, soft prompts, and inattention scoring can be built directly into the programming phase of your study, so quality control happens during collection instead of as a scramble afterward. There may be availability to support work 7 days a week, 365 days a year, which matters when a tracker needs a threshold recalibrated on a Saturday.
This fits agencies running trackers, corporate research teams managing panel fatigue, and healthcare or pharma researchers who prioritize sample quality. Our Full-Service Market Research engagements cover the whole arc, questionnaire review, programming, threshold calibration, fielding, and post-collection audits, so the rules in this article show up in your data rather than staying theoretical. If your study calls for quantitative rigor specifically, our Quantitative Market Research team can scope the programming and cleaning work directly. Reach out through our contact page to talk through your next fielding.
Sources
- Reducing speeding in web surveys by providing immediate feedback
- Two common checks fail to catch most bogus cases | Pew Research Center
- The Use of Data Cleaning Procedures in Probability-Based Panels (NORC research brief)
- Diagnosing survey response quality (Hillygus & LaChapelle chapter)
FAQ
What counts as a speeder in a survey?
A speeder is a respondent who completes a survey or specific items implausibly fast relative to the sample’s median dwell time, often defined as faster than half the median on common-route items. Speed alone is not proof of bad data, which is why researchers pair it with other quality indicators before excluding anyone.
Should I use the mean or median to set speeding thresholds?
The median is the better choice because it resists distortion from a few very slow or very fast outliers, a point methodologists studying survey response quality emphasize directly. Screen-level medians, calculated on common-route items, give a more stable baseline than a single mean completion time.
Does flagging speeders introduce bias into my data?
It can, since speeding has been shown to correlate with respondent age and education, meaning naive deletion rules risk skewing your sample. Auditing excluded respondents against retained ones on key demographics, as recommended in the survey response quality literature, helps catch this before it affects your topline numbers.
Are attention checks enough to catch low-quality respondents?
No. Standard speeding and attention checks together still miss most fraudulent or careless respondents, according to Pew Research’s analysis of online poll quality. Combining multiple indicators, straightlining, gibberish detection, duplicate checks, and manual review, catches far more than any single check run alone.
Can prompting respondents reduce speeding without hurting response rates?
Yes. Experiments using real-time feedback prompts across six separate web surveys found that prompts slowed subsequent speeding and improved some accuracy measures without a noticeable increase in breakoffs. That makes prompting a lower-risk first step than jumping straight to exclusion.