Use a matrix question when several items measure the same underlying construct with the same response scale, and skip it the moment either condition breaks. That is the whole decision in one sentence. Everything else is execution.
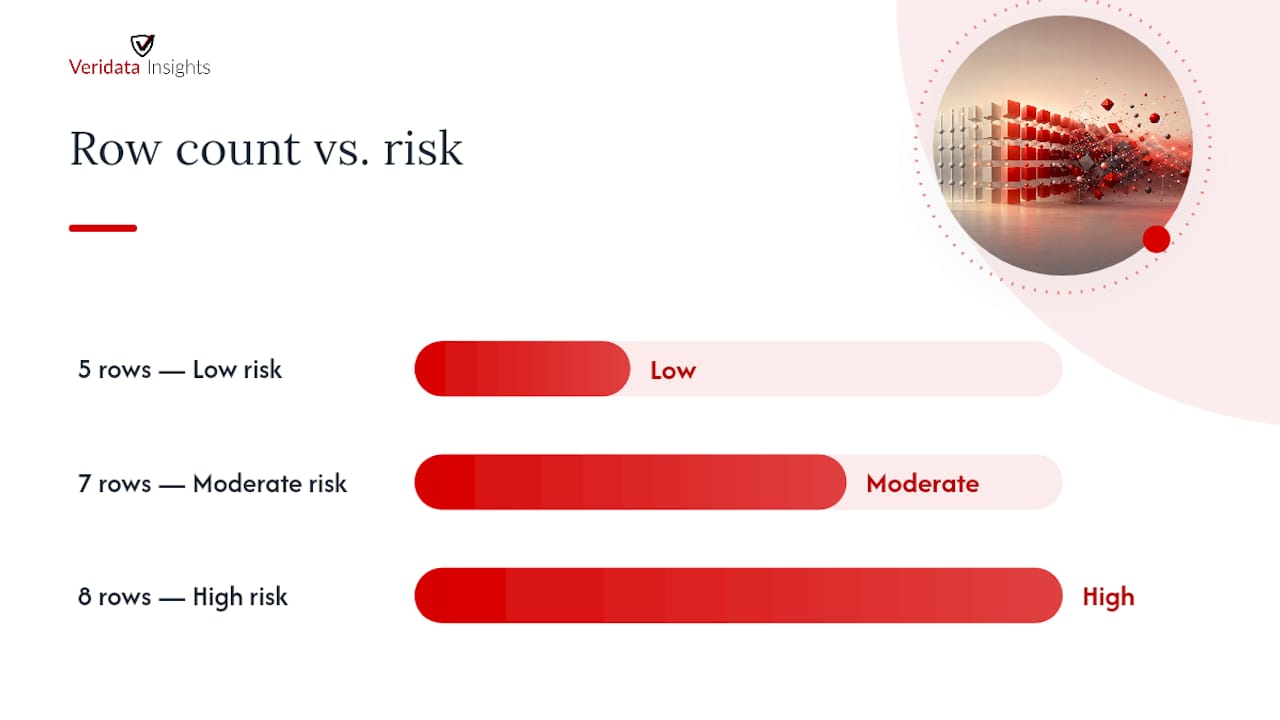
Before you drag one more row into a grid, check three things. First, cap rows around 5 to 8 and keep columns to 5 or 7 points for Likert-style scales — a widely cited practical ceiling puts rows times columns near 25 cells total. Second, confirm every column applies to every row; never mix a frequency scale with a satisfaction scale in one grid. Third, check your mobile share and pilot for straightlining before you field the real study.
- Rows ≤ 5 to 8, columns 5 or 7 points
- Columns must apply equally to every row (mutual applicability)
- Pilot on real devices and watch for straightlining before launch
Veridata Insights treats matrices as supporting detail, not headline metrics. If a number is going in an executive summary, ask it as a standalone item.
Key Takeaways
Matrix questions produce analyzable data only when rows share one construct and one scale, stay under roughly 8 items, and get pilot-tested on mobile before launch.
| Point | Details |
|---|---|
| Check mutual applicability first | Every column must genuinely apply to every row, or split the matrix into separate questions. |
| Cap rows at 5 to 8 | Larger grids raise straightlining and dropout, especially on mobile devices. |
| Use weighted averages correctly | Exclude N/A responses from the denominator instead of scoring them as zero. |
| Randomize rows when possible | Fixed order is only appropriate for validated, published scales. |
| Get a second review before fielding | Veridata Insights offers questionnaire review and programming QA to catch grid errors pre-launch. |
Table of Contents
- When Should You Use Matrix Question Design Instead of Single Items?
- Core Design Rules for Rows, Columns, and Response Types
- How Should You Word Matrix Stems and Row Items?
- How Do You Make Matrix Questions Work on Phones?
- How Do You Score and Analyze Matrix Responses?
- What Should Programmers Check Before Launch?
- Three Matrix Templates You Can Adapt Today
- What Are the Most Common Matrix Design Mistakes?
- Get Your Matrix Questions Reviewed Before You Field
- Frequently Asked Questions
- Sources
When Should You Use Matrix Question Design Instead of Single Items?
A matrix earns its place when the items are conceptually related, share a scale, and fit under the row cap. If any of those fail, split the battery or ask separately.
Run this checklist before you build anything:
- Are the items measuring the same underlying idea (satisfaction, agreement, frequency)?
- Do they all use the identical response scale, with no exceptions?
- Does the row count sit at or below the recommended cap of roughly 5 to 8?
- Is your mobile respondent share low enough that a grid won’t force horizontal scrolling?
When the answer to any of those is no, reach for an alternative. Single-item questions work better when items differ in scale or when one metric is a headline KPI that deserves its own screen. Pairwise comparison or forced ranking suits genuinely comparative judgments, like ranking five features by importance. When you have more items than any one respondent should see, a random subset or split-ballot design spreads the burden across the sample instead of overloading each person. Matrix questions work best when the shared scale genuinely fits every row, not when it’s forced to fit for convenience. If your objective favors precision over compactness, favor individual items every time. Veridata Insights’ survey design best practices guide covers this compactness-versus-quality tradeoff in more depth.
Core Design Rules for Rows, Columns, and Response Types
Row count is the single biggest lever you control. Industry guidance consistently points to 5 to 7 rows per screen as the sweet spot, with 8 as a hard outer limit before splitting into multiple pages or a conditional matrix that only shows applicable rows. Beyond that, cognitive load climbs and so does straightlining.
Columns follow a separate rule. Odd-numbered scales (5 or 7 points) give respondents a genuine midpoint and tend to outperform even-numbered “forced choice” scales for attitude measurement. Stay under 7 columns except in rare cases where a validated instrument requires more.
Three response types cover almost every matrix use case:
- Single-selection-per-row: mutually exclusive choices, the default for Likert-style agreement or satisfaction batteries.
- Multiple-selection-per-row: checkboxes when more than one answer per row is genuinely valid, such as “which of these channels did you use this week.”
- Weighted rating scales: numeric weights assigned to each column so you can compute averages instead of just frequencies.
Layout matters as much as structure. Keep scale direction consistent across every matrix in the survey. On grids that run long, use a sticky header so respondents never lose track of which column means what. On mobile, tap targets need real room. A survey experiment with more than 2,000 respondents found that five-row layouts reduced dropout and improved perceived ease compared to 10 and 20-row versions, and the columns tested (3, 5, and 7 points) showed real trade-offs in respondent burden. Smaller grids win more often than researchers expect.
How Should You Word Matrix Stems and Row Items?
The stem sets the task. Open with a short, explicit instruction, something like “Rate how much you agree with each statement below,” rather than a vague header that leaves respondents guessing whether they’re rating agreement, frequency, or importance.
Each row needs to stand alone as a single, self-contained statement. A row like “The product is affordable and easy to use” asks two questions at once and produces uninterpretable data when someone disagrees with one half and agrees with the other. Split it.
Order effects deserve real attention. Randomize rows whenever the scale isn’t a validated, published instrument that requires fixed sequencing. If you’re using a validated scale with fixed order, check your pilot data for position effects rather than assuming none exist.
- Do: “Please rate your agreement with each statement, from Strongly Disagree to Strongly Agree.”
- Don’t: “Statements” as a bare header with no instruction.
- Do: include one brief practice row before the real items so respondents calibrate to the scale.
Pro Tip: Test your stem wording out loud with a colleague before fielding. If they have to ask “rate what, exactly?” your instruction isn’t doing its job.
How Do You Make Matrix Questions Work on Phones?
Mobile is where matrices go to die. Horizontal scrolling, headers that disappear off-screen, and tap targets sized for a mouse cursor all degrade data quality fast, and they degrade it invisibly, since the respondent still submits an answer even when they tapped the wrong column.
Three fixes handle most of it. Add sticky headers so the column labels stay visible as respondents scroll down a long grid. Use alternating row shading and generous vertical spacing so eyes don’t jump rows, and size tap targets at a minimum of 44×44 pixels. Then preview on actual phones, not just a resized browser window.
Before launch, run through this UX check:
- Render the matrix across every common breakpoint, not just desktop and one phone size.
- Test with assistive technology to confirm the grid reads correctly for screen readers.
- Measure time-on-item and skip rates in the pilot, and flag anything that looks unusually fast.
Veridata Insights’ guide to mobile survey questionnaire design covers breakpoint testing in more detail if you’re building this into a standing QA process.
How Do You Score and Analyze Matrix Responses?
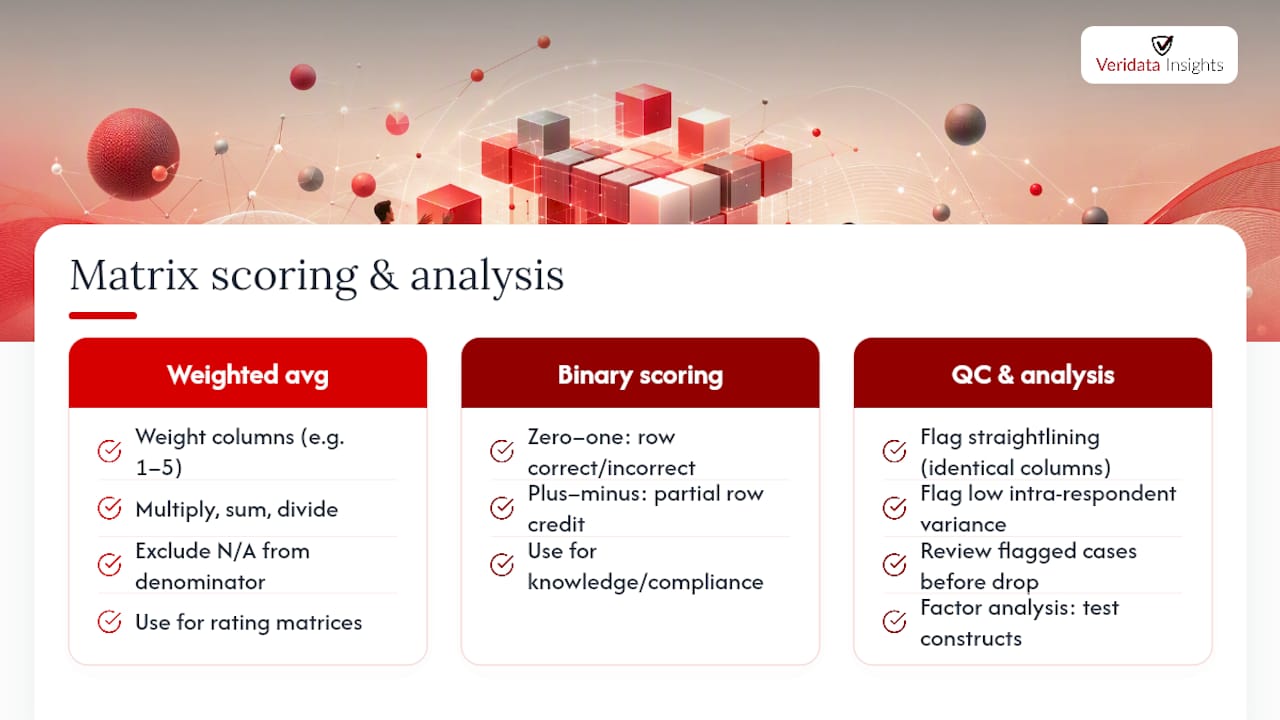
Weighted averages are the workhorse metric for rating matrices. Assign a numeric weight to each column (1 through 5, for example), multiply each response by its weight, sum, and divide by the number of valid responses. Platform documentation is explicit on one point that trips people up constantly: N/A responses must be excluded from the denominator, not counted as zero, or your average silently skews low.
Binary scoring works for a different purpose. Zero-one scoring counts each row as correct or incorrect, useful in knowledge or compliance batteries. Plus-minus scoring, common in testing and assessment contexts, awards partial credit row by row rather than requiring a perfect set to score any points at all.
Quality checks matter as much as the scoring formula. Flag respondents who select the identical column across every row (perfect straightlining) or whose intra-respondent variance across the matrix sits near zero. Set a threshold, review flagged cases before you drop them, and document the rule you used.
Once the data is clean, matrices reward deeper analysis. Factor analysis tests whether your rows actually measure one construct or secretly split into two. Cluster analysis on matrix responses can reveal respondent segments your topline averages hide entirely. Veridata Insights’ quantitative questionnaire design guide walks through both techniques for researchers building out full analysis plans.
What Should Programmers Check Before Launch?
Programming a matrix correctly takes more than dragging rows into a grid template. Run through this before it goes live:
- Confirm response constraints: single-selection enforced where required, multiple-selection enabled only where intended.
- Configure N/A columns so they’re excluded from weighted-average calculations, not silently coded as zero.
- Set forced-ranking rules if the matrix requires unique responses per column.
- Verify weight values are saved and persist correctly into the data export.
QA beyond the response logic matters just as much:
- Confirm header stickiness holds on scroll for long matrices.
- Check tab order and keyboard accessibility for respondents not using a mouse.
- Verify rounding on weighted averages doesn’t drift between the live preview and the final export.
Watch these metrics in pilot data: completion rate, dropout specifically at the matrix item, time per row, straightlining rate, and any gap between mobile and desktop completion. A gap wider than a few points usually means the grid needs to shrink.
Three Matrix Templates You Can Adapt Today
Likert satisfaction matrix (5 rows by 5 columns). Stem: “How satisfied are you with each aspect of your recent experience?” Rows might cover price, service speed, staff helpfulness, product quality, and ease of use, each scored Very Dissatisfied to Very Satisfied. Score with a weighted average, weights 1 through 5, N/A excluded from the denominator.
Single-row rating scale. Skip the grid entirely for one headline attribute, like overall satisfaction. Weights still apply the same way; you’re just removing the row dimension because the metric deserves its own screen.
Matrix multiple-response. Use checkboxes per row when more than one answer is valid, such as “which support channels have you used for each product.” Analyze response counts per row rather than a single weighted score, since respondents aren’t choosing one column.
Veridata Insights’ sample survey templates collection includes ready-to-adapt versions of all three.
What Are the Most Common Matrix Design Mistakes?
A grid with too many rows crammed onto one mobile screen is a fast way to increase straightlining. Mixing a frequency scale (“Never” to “Always”) with a satisfaction scale (“Very Dissatisfied” to “Very Satisfied”) in one matrix is a close second, since respondents can’t tell which mental model to apply row to row.
Watch for perfect or near-perfect straightlining and zero intra-respondent variance as your detection signals, and decide your remediation policy (flag, downweight, or exclude) before fielding, not after.
Run this before launch: row and column counts within cap, mobile preview complete on real devices, pilot metrics reviewed against targets, and export values checked against live-preview values.
Pro Tip: If your pilot shows more than a handful of straightliners on one matrix, the fix is almost never respondent quality. It’s usually the grid.
Get Your Matrix Questions Reviewed Before You Field
You’ve got the rules. What you may not have is the hour it takes to run a fresh set of eyes over your draft before it goes live, and that’s exactly where a second opinion pays for itself. Veridata Insights offers questionnaire review, programming QA, and pilot design and analysis as part of a full-service research build, covering everything from row-and-column checks to weighting configuration and post-pilot straightlining review.
Send your draft questionnaire through the contact page and include your pilot results if you have them; a matrix that looks fine on paper can behave very differently once real respondents hit it on a phone. Daniel and the Veridata Insights team review matrices for a living, across B2B, B2C, healthcare, and hard-to-reach audiences, and a quick consultation before fielding is often the cheapest fix you’ll make on the entire project.
Frequently Asked Questions
What is matrix question design in survey research?
Matrix question design is the process of structuring a grid of related items that share one response scale, so respondents rate each row using the same set of columns. It works only when the items measure the same underlying construct.
How many rows should a matrix survey question have?
Keep matrix grids to roughly 5 to 7 rows, with 8 as a practical outer limit. Beyond that, dropout and straightlining rise, especially among mobile respondents.
Can you mix different scales in one matrix question?
No. Mixing a frequency scale with a satisfaction scale in the same grid confuses respondents about which mental model applies, and it’s one of the most common matrix design mistakes researchers make.
How do you handle N/A responses in matrix scoring?
Exclude N/A responses from the denominator when calculating a weighted average rather than scoring them as zero, which is how most survey platforms configure weighted scoring by default.
What’s the difference between matrix questions and single-item questions?
A matrix groups related items under one shared scale to save space; a single-item question isolates one metric on its own screen. Use single items for headline KPIs or when the scale genuinely differs from other items in your survey.
Sources
- Matrix Questions in Surveys: Examples + When to Use Them | Lensym
- Matrix Question Design — 5 Pitfalls That Quietly Distort Your Data | Kicue
- What’s The Best Way To Design A Matrix Question?
- Matrix/Rating scale question guide | SurveyMonkey Help
- Matrix questions in surveys: when and how to use them | Typeform