The best market research report is layered and decision-first: a one-page executive summary with three to five prioritized recommendations, a 10 to 20 page functional report packed with evidence, and a methodology appendix holding the raw data. Recommendations come first, evidence second, methodology last. Executives read the summary in under five minutes; project teams work from the functional report for weeks; analysts keep the appendix on hand for when someone challenges a number.
TL;DR:
- The executive summary should focus solely on top recommendations, impact metrics, and confidence tags, with no dependency on detailed evidence or methodology.
- The functional report must present consistent, structured findings using a four-part template: headline, evidence, quotes, and strategic implications.
- Each finding should be accompanied by a clear owner, timeline, KPI, and confidence level in a decision-making table to facilitate action planning.
- Visuals must be simple, single-idea charts with annotations that tell the story without requiring additional explanation to speed comprehension.
- Respondent confidentiality and ethical standards should be strictly maintained, with raw data secured and identifying details anonymized throughout the report.
Table of Contents
- What Should a Research Report Structure Actually Include?
- How Should Each Finding Be Structured?
- What Makes an Executive Summary Actually Work?
- What Belongs in the Functional Report vs. the Appendix?
- How Do You Design Charts That Don’t Confuse Readers?
- How Do You Turn Findings Into an Action Plan?
- What Veridata Insights Brings to a Decision-Ready Report
- What Are the Typical Sections of a Market Research Report?
- How Does Report Structure Change by Research Type?
- How Do You Write a Clear Methodology Section?
- What Ethical and Confidentiality Standards Should a Report Follow?
- What Are the Most Common Mistakes in Research Report Writing?
- Ready to Commission a Report Built for Decisions?
- Sources
What Should a Research Report Structure Actually Include?
A report that changes nothing wasn’t structured for decisions. It was structured for filing. The fix is layering your deliverables so each audience gets exactly the depth they need, no more digging required.
Think of it as three separate documents that happen to travel together.
The executive summary runs one page, or one to two slides if you’re presenting. It carries three to five strategic recommendations, a confidence tag on each (“high confidence,” “directional,” “test further”), and the top-line impact metrics that justify the spend. Most executives never read past this page, according to guidance on market research reporting best practices, which is exactly why it needs to stand alone without any dependency on the pages behind it.
The functional report is where your product, marketing, and insights teams actually live. Expect 10 to 20 pages of finding-by-finding analysis, broken out by segment, with representative verbatim quotes and implementation notes attached to each finding. This is the layer that turns “customers want faster onboarding” into a spec someone can build against.
The appendix is your credibility layer. It holds the sample design, screener criteria, fieldwork dates, full crosstabs, and raw verbatim transcripts, each one clearly labeled for retrieval. A well-labeled appendix, referenced directly from the main report (think “see Appendix B: Crosstabs”), lets you jump straight to backup data mid-meeting instead of promising to “follow up.” A layered structure like this, described in more depth in our look at how market research drives strategic decisions, also prevents any single audience from wading through content meant for someone else. Analysts get depth without cluttering the summary. Executives get clarity without losing the paper trail.
How Should Each Finding Be Structured?
Every finding in your functional report should follow the same four-part sequence, every time. Consistency here is what makes a 15-page report scannable instead of exhausting.
- Headline. One sentence stating the finding in plain language (“Price sensitivity is highest among first-time buyers, not repeat customers”).
- Quantitative evidence. The numbers that back the headline: sample size, percentage, segment delta. Keep it to a sentence or two so the finding doesn’t drown in its own data.
- Qualitative evidence. A representative verbatim or two that puts a human voice behind the statistic. Requiring at least two supporting quotes per major insight keeps you from building a whole recommendation around one outlier’s opinion.
- Strategic implication. What the business should do about it, and how confident you are in that direction.
That fourth part is the one most reports skip, and it’s the one that actually drives action. Structuring findings this way means stakeholders don’t have to synthesize implications themselves, a principle laid out well in this stakeholder research reporting guide. Answer the “so what” for them, every time.
Pro Tip: Attach a confidence tier (high, moderate, directional) and a recommended next step directly under each finding’s implication line. It turns a report into a decision tool instead of a summary someone has to reinterpret later.
What Makes an Executive Summary Actually Work?
An executive summary earns its one page by leading with the headline recommendation and the business impact behind it, not a recap of methodology. Everything else supports that opening line.
- Follow the headline with three to five supporting insights, each tied to one line of evidence.
- Apply the pyramid principle: answer first, supporting argument second, evidence last, so the recommendation never gets buried under how you got there, per this breakdown of presenting research findings to stakeholders.
- Cap the main presentation deck at 10 slides, one idea per slide, with declarative titles (“First-time buyers churn within 30 days,” not “Churn Analysis”).
- Pair every slide with a single visual or verbatim quote, according to presentation guidance built for executive audiences.
- Send a pre-read 24 hours before the meeting, rehearse the walkthrough to 15 minutes, and keep appendix slides ready to pull up live during Q&A.
That 15-minute target isn’t arbitrary. A tight, rehearsed skeleton produces faster stakeholder alignment than a long, method-heavy deck that makes the room wait for the point.
What Belongs in the Functional Report vs. the Appendix?
Product, marketing, and operations teams need working detail, not decoration. Give each functional owner segment cuts relevant to their remit, cross-tabs with sample size (n) listed by segment, and verbatims mapped directly to the requirement they support.
The appendix exists for retrieval speed, not storytelling. Organize it with clear labels and direct references from the main report, so a challenged number can be answered in seconds during a live meeting instead of a follow-up email.
- Functional report: segment-level findings, implementation notes, sample verbatim tied to specific recommendations.
- Appendix: full screener, complete crosstabs, fieldwork dates, raw transcripts, methodology notes.
- Rule of thumb: if a stakeholder needs it to act, it’s functional. If they need it to verify, it’s appendix.
Our market research analysis workflow guide walks through how to build that segment-level detail without duplicating your appendix.
How Do You Design Charts That Don’t Confuse Readers?
One chart, one insight. That’s the whole rule, and most reports break it. If a chart needs a paragraph of explanation, it’s doing too much.
Stick to bars, lines, and simple tables. Skip dual-axis charts and anything that asks a reader to derive the point themselves. Annotate every visual with a one-sentence takeaway sitting right on the chart, not buried in a caption below it, a habit that speeds comprehension according to this stakeholder reporting framework. Use verbatim highlights as evidence anchors next to the data, not as decorative pull-quotes floating in white space.
Pro Tip: Before finalizing a slide, cover the chart and read only the annotation. If the annotation alone tells the story, the chart is doing its job. If you need the chart to fill in the gap, redesign it.
How Do You Turn Findings Into an Action Plan?
A finding without an owner is a suggestion nobody’s accountable for. Build a simple table with six columns: recommendation, rationale, owner, timeline, KPI, and confidence level. That last column matters more than people think. It tells the reader which bets to make now and which to test first.
- Prioritize using impact times effort, or a simple high/medium/low ranking if the group is short on time.
- Attach an immediate next step to each row so handoffs don’t stall waiting for someone to “figure out what this means.”
- Back each row with a short implementation brief, acceptance criteria, and a starter task list the receiving team can act on without a follow-up meeting.
This table becomes the bridge between the report and whatever project management tool your teams already use. Copy it into a brief the same day you present.
What Veridata Insights Brings to a Decision-Ready Report
A full-service market research firm can provide quantitative and qualitative research, often with flexible project minimums and extended operational availability. That flexibility matters when a report needs to move from fieldwork to executive deck faster than a typical agency retainer allows.
Recruitment for B2B, B2C, healthcare, and other hard-to-reach audiences can be provided as a specialized service. If you want a closer look at how the layered structure above gets built in practice, our guide to market research fundamentals for consulting firms and our sample survey templates are both good starting points.
What Are the Typical Sections of a Market Research Report?
Most commissioned reports settle into a familiar sequence, even when the layering above sits on top of it. You’ll typically see an introduction framing the business question, a methodology section describing how the data was gathered, a results section presenting findings, a discussion connecting those findings to strategy, and a conclusion with final recommendations.
The difference between a report that gets used and one that gets shelved usually isn’t which sections exist. It’s the order stakeholders encounter them in. A methodology-first report forces a busy brand manager to wade through sampling frames before reaching a single recommendation. Flip that order, put the conclusion and recommendations up front as the executive summary, and push methodology to the back as an appendix, and the same content becomes something people actually act on. The sections don’t change. The sequence readers meet them in does.
How Does Report Structure Change by Research Type?
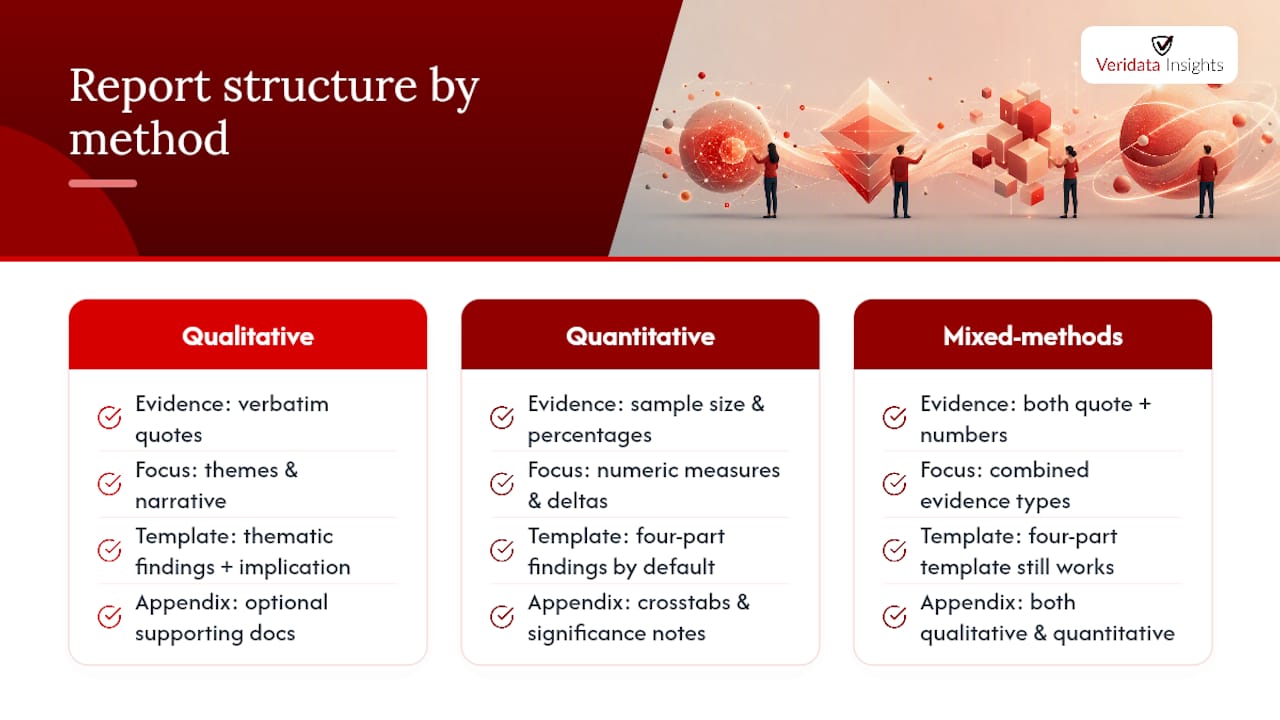
A qualitative study built on 20 in-depth interviews reads differently than a quantitative survey run across 1,500 respondents, and your report structure should reflect that.
Qualitative reports lean harder on verbatim excerpts, thematic groupings, and narrative pattern description, since the evidence is language, not percentages. Structure findings around recurring themes and let quotes carry the weight, then attach a strategic implication the same way you would for a numeric finding.
Quantitative reports lean on the four-part finding structure almost by default, since sample size, percentage, and segment delta are the currency of the evidence layer. Crosstabs and statistical significance notes belong in the appendix, not the narrative.
Mixed-methods reports need the clearest signposting of all. Label which evidence is quantitative and which is qualitative within each finding, so a reader never mistakes a single compelling quote for a validated trend across the sample. The four-part template still works here. It just needs both evidence types stated explicitly rather than blended into one paragraph.
How Do You Write a Clear Methodology Section?
A methodology section should answer four questions and stop: who was surveyed or interviewed, how many, when the fieldwork ran, and what method was used to reach them. Padding this section with jargon does not make the study look more rigorous, it just buries the numbers a skeptical stakeholder actually wants.
Keep sentences short and specific. “We surveyed a defined adult population online during a specified recent period, using a national panel. tells a reader everything they need in one line. Save the deeper detail, screener logic, quota structure, weighting approach, for the appendix, and reference it by name so anyone who wants the full protocol can find it fast.
Avoid vague framing like “a robust sample of consumers.” Name the number, the population, and the timeframe every time. That precision is what lets a skeptical brand manager trust the finding without demanding a follow-up call.
What Ethical and Confidentiality Standards Should a Report Follow?
Respondent confidentiality isn’t a footnote. It’s a structural requirement that shapes what goes into your appendix and what stays out of it entirely.
Verbatim quotes should be anonymized unless a respondent has explicitly consented to attribution, and any detail that could identify a specific participant, employer, job title, unique combination of demographics, needs to be stripped or generalized before it reaches a client deck. Raw transcripts and contact information belong in secured internal files, never in a shared appendix.
Reports commissioned for healthcare or other sensitive audiences carry extra weight here. Screener criteria and sample composition should be reported in aggregate, never in a way that lets someone reverse-engineer who participated. Disclose funding sources and any potential conflicts of interest plainly in the methodology section rather than leaving a client to assume neutrality. Ethical reporting isn’t just about protecting respondents. It protects the credibility of the findings themselves, since a report caught fudging attribution or obscuring its sample loses trust fast, no matter how strong the recommendations are.
What Are the Most Common Mistakes in Research Report Writing?
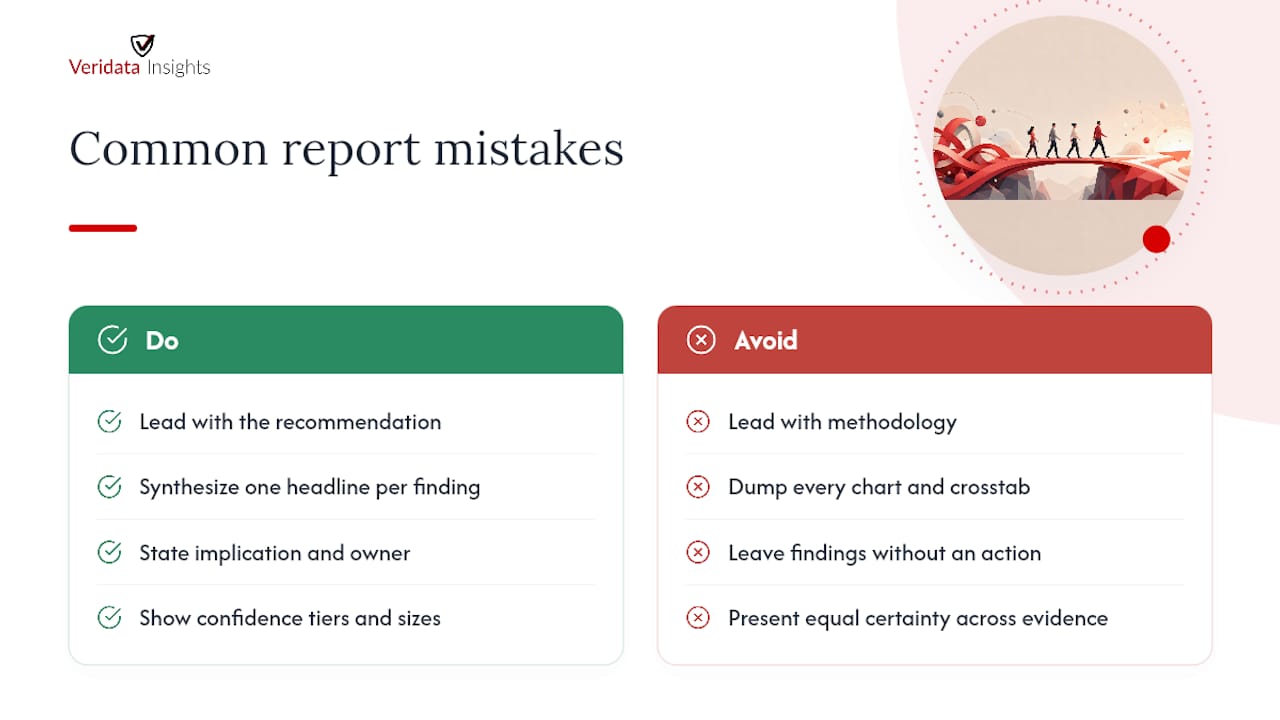
The most common failure is leading with methodology instead of the recommendation. By the time a busy stakeholder reaches page four, they’ve already decided the report is a chore, not a decision tool.
A second common mistake is data-dumping. Reports stuffed with every crosstab and every chart the analysis produced ask readers to do the synthesis work that the report itself should have done. If a finding needs three charts to explain, it needs a sharper headline, not more visuals.
Third, watch for findings with no attached action. A page of interesting statistics without a stated implication or owner reads as trivia, not strategy. Every finding needs its fourth part: the “so what.”
Fourth, inconsistent segment definitions across sections create confusion that undermines an otherwise solid report. If “high-value customers” means something different in the executive summary than it does in the appendix crosstabs, stakeholders will lose trust in the whole document.
Finally, skipping confidence tiers. Presenting a directional signal from 40 interviews with the same certainty as a validated trend from 1,500 survey responses misleads decision-makers into overcommitting on thin evidence.
Ready to Commission a Report Built for Decisions?
You’ve seen what separates a report people act on from one that gets filed and forgotten: layering, a repeatable finding structure, and evidence that’s traceable back to its source. This type of deliverable can be built without the constraints of traditional agency retainers and with flexible study sizing.
Services may include quantitative studies with segmented crosstabs, qualitative rounds with hard-to-reach respondents, or rebuilding existing datasets into decision-first formats, with support spanning methodology, questionnaire design, fieldwork, and reporting. If you’re weighing how a functional report should be organized for your own analysts, our data analysis workflow guide is worth a look before your next kickoff.
Request a consultation or ask for a sample report template through Veridata Insights’ contact page and get a structure built around your next decision, not just your next dataset.