The single best practice for likert scale design is this: build multi-item, construct-matched scales with 5 to 7 fully labeled points, then pilot for reliability before you ever report a number. Everything else in this guide supports that one rule.
Here’s your priority checklist before you draft a single item:
- Define the construct precisely. “Satisfaction” is not one thing. Decide which facet you’re measuring.
- Write single-idea stems. No double-barreled questions, no leading language.
- Use 5 to 7 response points, and label every single one, not just the endpoints.
- Match your response logic (bipolar or unipolar) to the construct itself.
- Run a small cognitive pilot, then check internal consistency before fielding at scale.
Pro Tip: Watch for straight-lining in your pilot data, where respondents pick the same column down an entire grid. It usually means your items feel repetitive or your survey is too long, not that everyone genuinely feels neutral about everything.
Run a cognitive pilot with a handful of real respondents before full deployment. It catches wording problems no amount of internal review will find.
Key Takeaways
Effective Likert scale design combines a clear construct definition, 5 to 7 fully labeled response points, construct-matched response logic, and a validated pilot process before any data gets reported.
| Point | Details |
|---|---|
| Match item to construct | Define the construct precisely and write single-idea stems before selecting response options. |
| Use 5 to 7 labeled points | Label every scale point, not just endpoints, to reduce interpretation variance across respondents. |
| Choose bipolar or unipolar deliberately | Match agreement scales to attitude items and unipolar scales to frequency or intensity items. |
| Pilot before fielding | Run cognitive interviews and a small quantitative pilot, then check Cronbach’s alpha or McDonald’s Omega. |
| Get an expert review | Veridata Insights reviews construct mapping, item wording, and psychometric plans to shorten your pilot cycle. |
Table of Contents
- What Is Likert Scale Design, and How Does It Differ From a Likert Item?
- When Should You Use a Likert Format Instead of Alternatives?
- How Do You Write Likert Items That Measure One Thing?
- How Many Response Points Should a Likert Scale Have?
- Why Does Labeling Every Point on the Scale Matter?
- Bipolar or Unipolar: Which Response Logic Fits Your Construct?
- How Do You Reduce Response Bias in Likert Surveys?
- What Does a Proper Likert Scale Pilot Look Like?
- How Should You Score and Report Likert Scale Results?
- What Are the Most Common Likert Scale Mistakes?
- What Are Some Ready-to-Use Likert Item Examples?
- What Does Veridata Insights Check in a Professional Questionnaire Review?
- Where Can You Learn More About Likert Scale Methodology?
- Get Your Likert Scale Reviewed Before You Field It
- Frequently Asked Questions About Likert Scale Design
- Sources
What Is Likert Scale Design, and How Does It Differ From a Likert Item?
A Likert item is one statement paired with an ordered set of response options, like “I trust this brand” scored from Strongly Disagree to Strongly Agree. A Likert scale is the sum or mean of several such items, all aimed at the same underlying construct. Confusing the two is the single most common terminology error in survey work, and it leads directly to bad analysis decisions.
This distinction is not academic hairsplitting. A single item produces ordinal data. You can rank responses, but you cannot assume the distance between “agree” and “strongly agree” equals the distance between “disagree” and “neutral.” That means single items belong to medians, modes, and nonparametric tests, according to research on analyzing Likert data.
A multi-item scale behaves differently. Once you combine several validated items into a composite score, that composite can often approximate an interval variable well enough to support parametric tests like t-tests and ANOVA, provided the scale has been validated first. That “provided” is doing real work. Skip the validation step and you’re just guessing.
Here’s why this matters for your project:
- Tracking studies that report a single satisfaction item should use medians and top-box percentages, not means.
- Composite indexes (a 6-item trust scale, for instance) can often support mean comparisons across groups once reliability is established.
- Mixing the two approaches in one report confuses stakeholders and can misstate your actual findings.
Our own primer on measuring consumer attitudes with Likert scales walks through this in more depth if you want additional worked examples.
When Should You Use a Likert Format Instead of Alternatives?
Likert items excel at measuring attitudes, agreement, satisfaction, and perceived frequency or intensity, but only when you match the response logic to what you’re actually asking. Attitude and agreement questions (“How much do you agree with X?”) are the classic use case. Satisfaction and importance ratings work well too, as long as you avoid forcing an agree/disagree frame onto a question that’s really about frequency.
Sometimes a Likert item is the wrong tool entirely. If you need respondents to rank options against each other, use a ranking task. If you’re measuring a yes/no behavior, a binary item is cleaner. Net Promoter Score has its own established methodology and shouldn’t be dressed up as a Likert item. Open text is better when you don’t yet know the range of possible answers.
Your research goal shapes point count and labeling too:
- Diagnostic research (finding problems) benefits from more granular scales, often 7 points, to catch subtle differences.
- Tracking studies (measuring change over time) need consistency above all, so lock your format early and never change it mid-study.
- Benchmarking against industry norms often requires matching whatever scale the benchmark itself uses.
How Do You Write Likert Items That Measure One Thing?
Start with a construct definition tight enough that two researchers reading it would write similar items independently. Map that construct into three to seven facets, then draft one or two candidate items per facet. If you can’t name the facets, you’re not ready to write items yet.
Follow these rules when drafting stems:
- State one idea per item. “The product is affordable and easy to use” mixes two ideas and should be split.
- Avoid leading language that predisposes the respondent to a particular answer.
- Write at a plain reading level appropriate for your audience.
- Mix specific and general phrasings deliberately for both broad and detailed measurement.
- Use reverse-coded items sparingly and only when they legitimately test an opposite pole, avoiding simple negations that confuse respondents.
Reverse wording is a legitimate tool for catching acquiescence bias, the tendency to agree with statements regardless of content. But an overly clever reverse item can confuse respondents just as easily as it detects careless ones, according to research on detecting careless responding. If a reverse item requires a double negative to parse, rewrite it.
Run 5 to 20 cognitive interviews once you have a draft set. Ask respondents to read each item aloud and explain what they think it’s asking. You’ll catch ambiguous wording that no amount of internal review would surface, a step SurveyMonkey’s guidance on Likert best practices also flags as essential before fielding.
A few stems worth adapting to your own construct: “I would recommend this employer to a friend” (job satisfaction), “This organization follows through on its commitments” (trust), “I use this feature at least once a week” (frequency), and “This factor influences my purchase decision” (importance).
How Many Response Points Should a Likert Scale Have?
Five to seven points is the sweet spot for most Likert scale designs, and reliability gains taper off sharply beyond seven. Respondents genuinely struggle to discriminate between finer gradations, like the difference between “6” and “7” on a 10-point agreement scale, which is why practitioner analysis of 5-point versus 7-point formats consistently favors the smaller ranges.
The odd-versus-even question comes down to whether true neutrality exists for your construct. If respondents can genuinely feel neutral (many attitude and opinion questions), include a midpoint. If you need to force a lean one way or the other, an even-point scale without a midpoint works, but be honest that you’re doing this to eliminate fence-sitting, not because neutrality doesn’t exist.
Mobile respondents change the calculus. A 7-point scale with full labels can wrap awkwardly on a small screen, and research on offline and mobile survey tools points to shorter scales and simplified layouts as the more reliable choice for phone-based fieldwork.
Rescaling data from a 5-point study to compare against a 7-point benchmark is possible, but every conversion introduces distortion. Avoid it when you can just field the same scale as your comparison point.
Pro Tip: When in doubt, default to 5 points for general population surveys and reserve 7 points for expert or highly engaged panels who can reliably discriminate finer distinctions.
Your quick decision path: if you’re tracking change over time, prioritize consistency over granularity. If you’re diagnosing a problem, add points. If your sample skews mobile or low-literacy, go smaller.
Why Does Labeling Every Point on the Scale Matter?
Label every point, not just the endpoints. A scale with only “Strongly Disagree” and “Strongly Agree” marked leaves the middle points open to individual interpretation, and two respondents can mean entirely different things by an unlabeled “3.” Fully labeled scales produce measurably more consistent responses, according to CASRAI’s guide to Likert scale construction.
Choose endpoint wording carefully. Vague terms like “sometimes” mean different things to different people; “About half the time” is more precise. Keep your labels parallel and symmetric around the midpoint, so the emotional distance from “somewhat agree” to “agree” roughly matches the distance from “somewhat disagree” to “disagree.”
Stay consistent across your instrument. Don’t switch between Agree/Disagree anchors on one page and Satisfied/Dissatisfied anchors on the next unless the construct genuinely changes, since research on construct-matched anchor wording shows mismatched frames introduce measurement noise.
If you’re translating a scale, adapt for meaning rather than literal wording. “Strongly agree” doesn’t always have a natural equivalent in every language, and a translator who preserves grammar but loses intensity will quietly distort your data.
Bipolar or Unipolar: Which Response Logic Fits Your Construct?
Bipolar scales run between two opposite poles, like Disagree to Agree or Dissatisfied to Satisfied, and they measure direction plus intensity. Unipolar scales measure degree of a single attribute, running from “none” to “a great deal,” and they suit constructs like frequency or importance where there’s no natural opposite pole.
The rule of thumb is straightforward: use bipolar formats for agreement and attitude questions, unipolar formats for frequency, intensity, and importance. “How often do you use this feature?” doesn’t have an opposite pole to disagree with, so forcing it into an Agree/Disagree frame breaks the logic entirely.
This mixing mistake shows up constantly in poorly designed surveys. An item like “I frequently recommend this product” scored on a Disagree to Agree scale asks respondents to translate a frequency judgment into an agreement judgment, adding a layer of interpretation that muddies your data.
A few quick construct-to-logic mappings: attitude toward a brand pairs with bipolar agreement scales. Usage frequency pairs with unipolar scales (Never to Always). Perceived importance pairs with unipolar intensity scales (Not at all important to Extremely important). Satisfaction can go either way depending on whether you’re measuring direction (satisfied versus dissatisfied) or pure degree.
How Do You Reduce Response Bias in Likert Surveys?
Acquiescence bias (the tendency to agree regardless of content), straight-lining (selecting the same answer down a grid), social desirability bias, and general careless responding are the four biases that quietly corrupt Likert data most often.
Reverse-worded items help you detect acquiescence, since a careless or acquiescent respondent will “agree” with contradictory statements. But complex reverse items can confuse thoughtful respondents just as easily, and research on detecting careless responding recommends balancing positive and negative phrasing without resorting to tricky double negatives.
A few practical defenses:
- Mix positive and negative items sparingly, at maybe one reversed item per five to seven positive ones.
- Add an attention check item (“Please select ‘Somewhat Agree’ for this question”) in longer surveys.
- Randomize item order across blocks when feasible to disrupt pattern-based responding.
- Screen your pilot data for straight-lining before you trust any reliability statistics.
Long, monotonous grids are the single biggest driver of this behavior.*
If your survey includes rating tasks similar to structured evaluation formats, guidance on interview scorecard best practices offers useful parallel thinking on reducing rater bias.
What Does a Proper Likert Scale Pilot Look Like?
A defensible pilot has three stages, and skipping any of them is how bad scales end up in final reports.
- Cognitive interviews first. Sit down with 5 to 20 respondents and have them think aloud through each item. This is where you catch confusing wording before it costs you a full fieldwork budget.
- Small quantitative pilot next. Field the revised instrument to roughly 50 to 200 respondents, depending on how many items and subscales you’re testing. This is your first real look at how the numbers behave.
- Reliability and dimensionality checks. Calculate internal consistency and confirm your items actually cluster the way you expect.
For internal consistency, Cronbach’s alpha above 0.70 is generally acceptable for research purposes, and above 0.80 is the bar for high-stakes decisions, per guidance from Jotform’s Likert scale overview. Alpha isn’t the only tool worth knowing, though. McDonald’s Omega handles violations of the equal-loading assumption that alpha quietly ignores, and it’s increasingly the preferred metric among psychometricians working with modern factor models.
Run exploratory factor analysis on your pilot data to see whether items load onto the dimensions you intended. Watch for cross-loadings, items that load meaningfully onto more than one factor, since those usually signal a stem that’s measuring two things at once. Confirmatory factor analysis comes later, once you’re validating a scale you plan to reuse across studies.
A systematic review of Likert scale construction distilled these steps into fifteen concrete recommendations covering construct definition through score interpretation, a useful checklist to keep next to your pilot plan. Advanced teams increasingly layer in Item Response Theory and coefficient omega, tools that recent psychometric research shows can sharpen item selection well beyond what alpha alone reveals.

Your stop/go criteria before full fielding: alpha above 0.70, no glaring cross-loadings, and no item flagged as confusing by more than 10% of your cognitive interview sample.
How Should You Score and Report Likert Scale Results?
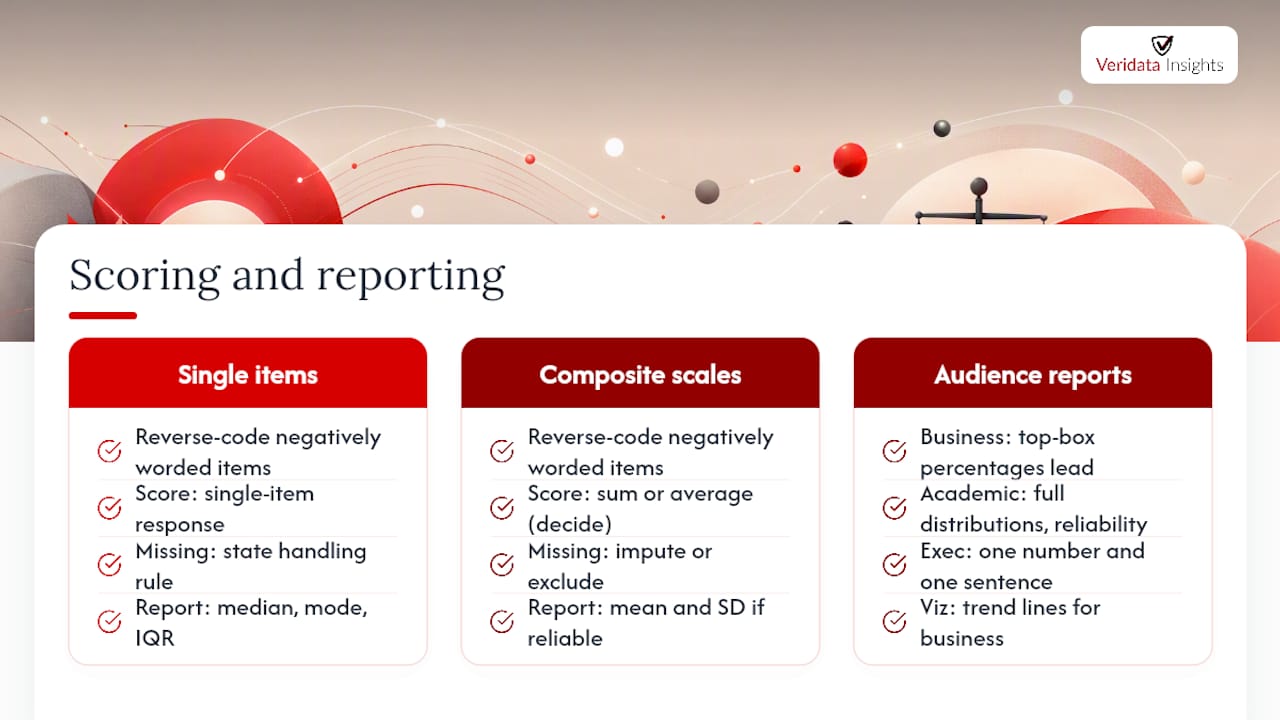
Reverse-code your negatively worded items before you calculate anything else. This is the step people forget most often, and it silently deflates reliability statistics when skipped.
For multi-item scales, decide between summing and averaging. Averages are easier to interpret across scales with different item counts; sums preserve more granularity if every respondent answered every item. Handle missing item responses with a clear rule stated up front, whether that’s pairwise deletion, mean imputation for scales with minimal missingness, or excluding the composite score entirely when too many items are blank.
What you report depends on the data type. Single items call for medians, modes, and interquartile ranges, not means, because the underlying scale is ordinal, a point research on analyzing Likert data makes directly. Multi-item composites that have cleared reliability testing can defensibly report means and standard deviations.
For inferential tests, nonparametric options like Mann-Whitney U or Kruskal-Wallis fit single items best. Validated multi-item scales can often support t-tests or ANOVA, with the caveat that you should still check your distributions for extreme skew.
Visualization should match your scale logic. Diverging stacked bar charts work well for bipolar items, since they show the split between agreement and disagreement around a center point. Regular stacked bars suit unipolar frequency or intensity data. Boxplots communicate composite scale distributions cleanly to technical audiences.
For business stakeholders, grouping responses into top-box and bottom-box percentages (the share who chose the top one or two options) often lands better than a raw mean, since it translates directly into “most customers are satisfied” language executives actually use.
Academic reports should include full distributions, reliability statistics, and factor loadings. Business reports should lead with top-box percentages and trend lines. Executive summaries should lead with one number and one sentence, saving the methodology for an appendix.
What Are the Most Common Likert Scale Mistakes?
The double-barreled item tops the list every time: a single stem asking about two things at once, forcing respondents to average their answer across concepts you meant to measure separately. Mixing scale frames within one instrument (Agree/Disagree on one page, Satisfied/Dissatisfied on the next, for no principled reason) is a close second.
Unlabeled midpoints and forced neutral responses when true neutrality genuinely exists both distort your data in opposite directions. So does treating a single ordinal item as though it produces interval data suitable for a mean and standard deviation.
A quick QC pass before fielding should catch:
- Any stem containing “and” joining two distinct concepts.
- Inconsistent anchor frames across the instrument.
- Any scale point left unlabeled.
- Reverse-coded items that haven’t actually been flagged for reverse scoring in your data file.
- Translations that changed intensity or tone rather than preserving meaning.
Our breakdown of common survey design mistakes covers several of these failure modes with more real-world examples, and our guide to common quantitative research mistakes digs into the analysis-side errors specifically.
What Are Some Ready-to-Use Likert Item Examples?
A short item bank by construct saves you from starting each project from a blank page.
Satisfaction: “Overall, how satisfied are you with [product/service]?” (Very Dissatisfied to Very Satisfied, 5 points)
Trust: “I believe this company acts in my best interest.” (Strongly Disagree to Strongly Agree, 7 points)
Intent: “How likely are you to purchase this product again?” (Very Unlikely to Very Likely, 5 points)
Frequency: “How often do you use this feature?” (Never to Always, 5 points, unipolar)
Importance: “How important is price when choosing this type of product?” (Not at all important to Extremely important, 7 points)
A compact template for a 5-item scale: pick your construct, write one general item and three to four specific facet items, apply a consistent 5 or 7-point fully labeled scale, and pilot with at least 50 respondents before treating the composite score as reportable. Adjust wording complexity down for general consumer panels and keep item counts on the shorter end for mobile-first fieldwork. Our collection of survey question examples and sample survey templates give you more starting points to adapt.
What Does Veridata Insights Check in a Professional Questionnaire Review?
A trained eye catches problems your team has read past a dozen times. When Veridata Insights reviews a questionnaire, we map every item back to its construct, flag double-barreled stems, check anchor consistency across the instrument, and audit reverse-coded items for genuine clarity rather than clever wording that trips people up.
We also build out the pilot and psychometric plan alongside you, from cognitive interview scripts to reliability thresholds, so your team knows exactly what “ready to field” looks like before launch. That review step routinely shortens the pilot cycle because it catches wording and logic problems before they cost you a full round of fieldwork and re-analysis.
This matters most with complex audiences. B2B decision-makers, healthcare professionals, and hard-to-reach populations don’t forgive a confusing survey the way a general consumer panel might; they simply drop out.
Pro Tip: If your survey touches a regulated industry like healthcare or finance, a second set of eyes on wording and consent language pays for itself the first time it prevents a re-fielding.
Our questionnaire design guide covers additional review checkpoints worth running before you finalize an instrument.
Where Can You Learn More About Likert Scale Methodology?
For drafting guidance, start with the systematic review of Likert scale construction, which distills the academic literature into fifteen practical recommendations. For anchor and labeling rules, CASRAI’s Likert scale guide remains a solid practitioner reference.
For analysis decisions, research on analyzing Likert data explains when medians beat means and when composite scores can support parametric tests. For advanced psychometrics, including Item Response Theory and coefficient omega, the selective review of Likert scale advances is worth the deeper read.
For fieldwork quality control, research on detecting careless responding covers straight-lining detection in more technical detail. Practitioner-focused overviews from SurveyMonkey and Jotform round out the reliability thresholds and cognitive interview guidance referenced throughout this piece.
Get Your Likert Scale Reviewed Before You Field It
Reading about double-barreled items is one thing. Catching them in your own draft before they cost you a re-fielding budget is another. Veridata Insights offers full questionnaire review as part of our broader research services, checking construct mapping, item wording, response logic, and your reliability plan before your survey ever goes live.
This fits naturally if you’re a researcher or brand team without in-house psychometric expertise on staff, or if you’re fielding a study for a B2B, healthcare, or hard-to-reach audience where a confusing item means a lost respondent, not just a bad data point. We handle everything from methodology consultation and programming through data collection, coding, and reporting, so your Likert scale doesn’t sit in isolation from the rest of your instrument.
If you have a draft questionnaire sitting in a folder right now, reach out to Veridata Insights and get it reviewed before you spend your fieldwork budget on it.
Frequently Asked Questions About Likert Scale Design
What is the ideal number of points for a Likert scale?
Five to seven points works best for most research goals. Reliability gains taper off beyond seven points because respondents struggle to discriminate finer gradations reliably.
Should a Likert scale always include a midpoint?
Include a midpoint when true neutrality can genuinely exist for your construct. Force an even-point scale without a midpoint only when you have a specific reason to eliminate fence-sitting.
How do you analyze Likert scale data correctly?
Treat single items as ordinal data and report medians, modes, or top-box percentages. Multi-item composite scales that have passed reliability testing can often support means and parametric tests.
What is a good Cronbach’s alpha for a Likert scale?
Above 0.70 is generally acceptable for research purposes, and above 0.80 is the standard for high-stakes decisions. McDonald’s Omega is a useful complement when your items violate alpha’s equal-loading assumption.
Can you mix bipolar and unipolar items in the same survey?
Yes, across different constructs within one instrument, but never within a single item. Keep agreement scales bipolar and frequency or intensity scales unipolar, and never blend the two logics in one stem.
Sources
- Analyzing Likert data — PMC
- Likert Scales: A Practical Guide to Design, Construction and Use — PubMed
- Likert Scale: Examples & Analysis — CASRAI
- Advances in Likert scale development: selective review (Frontiers in Psychology)