
TL;DR:
- Effective survey methodology begins with defining clear analytical outputs and building questions backward from those goals to ensure data relevance.
- Piloting with 30-50 respondents and conducting cognitive interviews before full data collection identify workflow issues, comprehension problems, and potential errors, improving data quality.
Survey methodology is defined as a structured sequence of phases that guides researchers from setting precise analytical goals through to final data cleaning and analysis, producing reliable and defensible results. The industry term is survey research methodology, and the step by step survey methodology framework operationalizes it into a repeatable workflow. Effective survey design follows a 7-step process starting with defining your analytical output and ending with data cleaning. Skipping that first step is the leading cause of unanalyzable data, and surveys exceeding 30 questions see measurable drops in completion rates. Get the sequence right, and your data works. Get it wrong, and no amount of analysis rescues it.
What is the step by step survey methodology process?
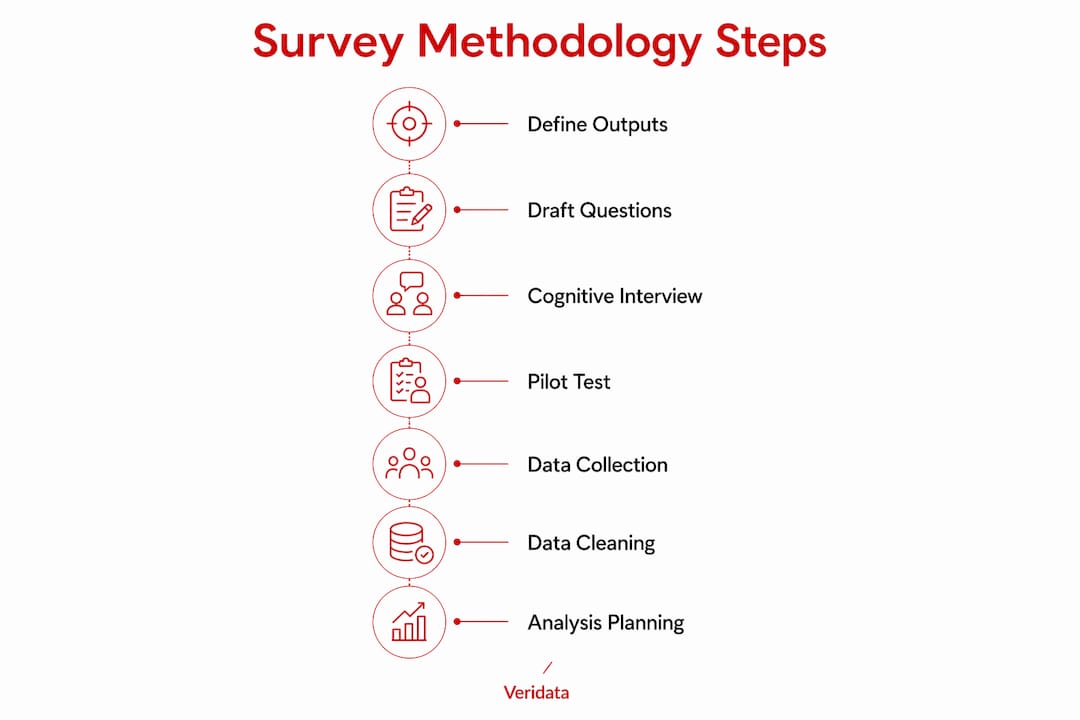
Survey methodology is not just about writing questions. It is about designing the analytical output and data architecture that guides every decision you make. Think of it as building a house: you draw the blueprints before you pour the foundation. The seven core phases are defining analytical outputs, identifying your target population, drafting questions, cognitive interviewing, field piloting, full data collection, and data cleaning with analysis.
Each phase depends on the one before it. Cognitive interviewing, for example, only catches comprehension problems in your question wording. It cannot tell you whether your enumerators are confused by skip logic or whether your survey takes 20 minutes longer than planned. That is what field piloting is for. Treating these phases as interchangeable or optional is where most survey projects go sideways.
How to define clear analytical outputs and target populations
The single most important step in the survey design process is defining what your analysis tables will look like before you write a single question. Strong questionnaires are built backwards from the analysis plan rather than forwards from topics. If you cannot point to a specific output that a question feeds, that question does not belong in your survey.

An analytical output is a specific finding you intend to report. Examples include “percentage of respondents who experienced X by demographic group Y” or “mean score on indicator Z compared across cohorts.” Defining these outputs first forces you to identify exactly which variables you need, which data scales those variables require, and which respondent groups you must reach. It also defines your sample size, since the statistical precision you need for each subgroup comparison determines how many responses you must collect from each segment.
The contrast between vague and precise analysis goals is stark in practice:
| Analysis goal | Effect on data usability |
|---|---|
| “Understand customer satisfaction” | Produces unstructured data with no clear metric or comparison point |
| “Mean NPS score by product line and region, Q1 vs. Q3” | Drives specific question format, scale, and sampling requirements |
| “Awareness rate of Program X among 18-34 urban respondents” | Defines target population, sample size, and required question type |
| “Barriers to adoption ranked by frequency across income segments” | Requires Likert or ranking scale, specific demographic screeners |
Pro Tip: Before finalizing your question list, map every question to a specific cell in your analysis table. If a question does not fill a cell, cut it. Scope creep reduces respondent engagement by up to 30%, and a bloated survey hurts both completion rates and data quality.
How do you draft questions, run cognitive interviews, and structure a questionnaire?
Question drafting begins with your indicators. Each indicator maps to one or more questions, and each question requires a deliberate choice of data scale. Nominal scales label categories without ranking (gender, region, product type). Ordinal scales rank without equal intervals (satisfaction ratings, agreement levels). Interval scales have equal spacing but no true zero (temperature, standardized test scores). Ratio scales have equal spacing and a true zero (income, age, number of purchases). Choosing the correct data scale before drafting is non-negotiable because the scale determines which statistical tests are valid at the analysis stage.
Response options must be mutually exclusive and exhaustive. Mutually exclusive means no respondent can legitimately select two options simultaneously. Exhaustive means every possible answer is covered, including an “other” or “none of the above” option when needed. Violating either rule produces data errors that cannot be corrected after collection.
Once your draft questions exist, cognitive interviewing with 5 to 10 respondents surfaces comprehension problems before they contaminate your data. In a cognitive interview, respondents think aloud as they read and answer each question. You learn whether they interpret “recent” as the last week or the last year, whether a scale label like “somewhat agree” means the same thing to different people, and whether any question triggers confusion or discomfort. This is not the same as a pilot test. Cognitive interviews are about language and comprehension. Pilots are about workflow and logistics.
Common pitfalls in question wording and structure include:
- Double-barreled questions: “How satisfied are you with the price and quality?” forces one answer for two separate constructs.
- Leading language: “How much did our excellent service improve your experience?” primes a positive response.
- Undefined time frames: “How often do you exercise?” without specifying a reference period produces incomparable answers.
- Overlapping response ranges: Age brackets like “20-30” and “30-40” leave the 30-year-old with two valid options.
- Jargon without definition: Technical terms that mean different things to different respondent groups destroy comparability.
Questionnaire flow also matters. Group questions by topic so respondents are not mentally jumping between unrelated subjects. Place sensitive questions (income, health status, political views) toward the end, after rapport is established. Proper skip logic design reduces missing data and enumerator confusion. Ambiguous routing is one of the most common sources of inconsistent data in field surveys.
Pro Tip: Test your skip logic by manually tracing every possible path through the questionnaire before cognitive interviews begin. A routing error caught at this stage costs minutes. One caught after full data collection costs the entire dataset.
How to conduct field pilots and manage full data collection
Field pilot testing is the only way to uncover enumerator workflow problems, timing issues, and respondent fatigue points before main data collection begins. A cognitive interview tells you whether respondents understand your questions. A field pilot tells you whether your entire survey operation works. These are fundamentally different quality checks.
Run your pilot with 30 to 50 respondents drawn from the same population as your main study. Use the same enumerators, the same devices or paper forms, and the same recruitment approach. Track completion time per section, note where enumerators ask for clarification, and record where respondents hesitate or abandon. Pre-launch pilot testing leads to an average of 5 to 15 questionnaire revisions that improve both data quality and logistical effectiveness. Pilot data is excluded from the main dataset to preserve integrity.
| Phase | Typical issues detected | Outcome |
|---|---|---|
| Cognitive interview | Question wording, scale confusion, term interpretation | Revised question language |
| Field pilot (30-50 respondents) | Timing overruns, skip logic errors, enumerator confusion | Revised workflow and routing |
| Full data collection | Response rate variation, data entry errors, outliers | Quality control flags and callbacks |
During full data collection, enumerator training is not optional. Every enumerator must understand the survey’s purpose, the correct way to read each question, and how to handle respondent questions without introducing bias. Standardized training reduces interviewer effects, which are systematic differences in responses caused by how different interviewers administer the same survey.
Pro Tip: Build a daily data quality check into your fieldwork schedule. Review incoming responses each evening for skip logic violations, implausible values, and straight-lining (respondents selecting the same answer for every item in a scale battery). Catching these issues on day two is recoverable. Catching them on day 20 is not.
How does data cleaning and analysis planning ensure consistent results?
Data cleaning is the process of identifying and resolving errors, inconsistencies, and missing values in your raw dataset before analysis begins. It is not a glamorous step, but it is where the integrity of your findings is either protected or compromised. The cleaning process covers error checking (values outside valid ranges, impossible combinations), managing missing data (distinguishing between skipped questions and routing-appropriate non-responses), and verifying that skip patterns were followed correctly.
Key data cleaning steps for any survey dataset include:
- Range checks: Flag any response outside the defined valid range for each variable.
- Consistency checks: Verify that logically related questions align (a respondent who says they have never purchased a product should not have a follow-up answer about purchase frequency).
- Duplicate detection: Identify and resolve cases where the same respondent appears to have submitted multiple responses.
- Missing data audit: Distinguish between data missing at random and data missing because of a systematic pattern (such as a specific enumerator skipping a section).
Analysis planning should happen before data collection, not after. Designing analysis tables before writing questions prevents scope creep and ensures every variable you collect has a defined role in your outputs. For longitudinal or repeated surveys, persistent participant identifiers assigned before wave one are critical. Using names or email addresses as identifiers introduces significant matching errors across waves.
Consistent question wording and response scales across survey waves are non-negotiable for cohort comparability. Changing a five-point Likert scale to a seven-point scale between wave one and wave two destroys your ability to make valid pre-post comparisons. Lock your question wording, scale labels, and response options before wave one launches and treat any proposed change as a structural decision requiring full documentation.
Pro Tip: Create a data dictionary before fieldwork begins. Document every variable name, its valid range, its data scale, and the question it maps to. This document becomes your cleaning checklist and your analysis guide, and it saves hours when a new team member joins mid-project.
Key takeaways
Effective survey methodology requires defining your analytical outputs first, then building every subsequent step backward from that foundation to produce valid, comparable, and analysis-ready data.
| Point | Details |
|---|---|
| Define outputs before questions | Map every question to a specific analysis table cell before drafting begins. |
| Use correct data scales | Match Nominal, Ordinal, Interval, or Ratio scales to each indicator to enable valid statistical tests. |
| Pilot with 30-50 respondents | Field pilots catch workflow and timing issues that cognitive interviews cannot detect. |
| Lock wording across waves | Changing scales or question text between survey waves destroys longitudinal comparability. |
| Clean data before analysis | Run range checks, consistency checks, and skip pattern audits before any analysis begins. |
Why most survey projects fail before the first question is written
Here is what I have seen repeatedly across research projects: teams spend weeks debating question wording and almost no time defining what they actually need to know. The questionnaire becomes the project, when it should be the output of a much more deliberate process.
The step by step survey design guide I follow always starts with a blank analysis table. Not a blank question list. A blank table with the rows and columns I intend to fill with findings. Every question I write has to earn its place by filling a cell in that table. When I started doing this consistently, the average length of my questionnaires dropped by about a third, and the quality of the data I got back improved noticeably.
Cognitive interviewing is another area where I see shortcuts taken. Five respondents feels like a lot when you are under deadline pressure. But I have caught fundamental comprehension errors in round one of cognitive testing that would have invalidated entire sections of data. The survey authoring process is where most data quality problems are born, and pretesting is the only reliable way to find them before they cost you.
The data cleaning step gets the least respect and causes the most post-collection pain. I have worked on projects where cleaning took longer than fieldwork because no one built a data dictionary or defined valid ranges in advance. Build your cleaning protocol before you collect a single response. You will thank yourself later.
— Daniel
How Veridatainsights supports your survey design from start to finish
Veridatainsights handles every phase of the survey design process, from questionnaire design and methodology through programming, data collection, quality control, and reporting. Whether you need a full-service research partner or support for one specific phase, there are no project minimums and no rigid service packages. The team works seven days a week, 365 days a year, across B2B, B2C, healthcare, and hard-to-reach audiences. If you want data you can trust and a team that knows how to get it, reach out to Veridatainsights and tell us what you need.
FAQ
What is survey methodology?
Survey methodology is the structured process of designing, administering, and analyzing surveys to produce valid and reliable data. It covers everything from defining analytical goals and sampling to question drafting, pretesting, data collection, and cleaning.
How many questions should a survey have?
Surveys should generally stay under 30 questions to maximize completion rates, with in-person surveys capped at roughly 30 to 45 minutes of administration time. Longer surveys increase dropout rates and reduce data completeness.
What is cognitive interviewing in survey design?
Cognitive interviewing is a pretesting method where 5 to 10 respondents think aloud while completing a draft survey, revealing comprehension problems in question wording and scale interpretation before full data collection begins.
Why do survey waves need consistent question wording?
Changing question wording or response scales between survey waves destroys the comparability of data across time points. Consistent wording and scales are required to make valid pre-post or cohort comparisons in longitudinal research.
What is a persistent participant identifier?
A persistent participant identifier is a unique code assigned to each respondent before the first survey wave, enabling accurate data linkage across multiple waves without the matching errors that come from using names or email addresses.


