Straightlining is repeated, near-identical responding across a battery of items, and it is one of the most common threats to survey data quality. The standard way to catch it is a long-string index, which flags respondents whose longest run of identical answers exceeds a distribution-based threshold. The best-practice rule: flag first, then require at least one other sign of careless responding, like speeding or a failed attention check, before excluding anyone.
TL;DR:
- Most survey platforms provide basic long-string flags, but setting thresholds based on the sample’s distribution is more accurate than using fixed cutoffs.
- Combining straightlining flags with other indicators like response speed and attention check failures creates a more defensible exclusion process.
- Not all uniform responses indicate careless responding; genuine neutrality on similar items can produce uniform answers without validity concerns.
- Using shorter, varied, and mobile-friendly grid questions reduces the likelihood of intentional or unintentional straightlining.
- Maintaining an audit trail with documented, pre-registered screening rules ensures data cleaning remains transparent and legally defensible.
Table of Contents
- What Straightlining Detection Actually Measures
- Straightlining Detection Methods: Indices and Practical Calculations
- Interpreting Flags: When to Exclude, When to Investigate
- Questionnaire and UX Fixes to Reduce Straightlining
- Veridata Insights’ Approach to Defensible Screening
- What Straightlining Detection Looks Like in Practice
- Cleaning Data Once Straightlining Is Confirmed
- Beyond the Long-String Index: Other Metrics Worth Tracking
- Software and Platforms for Straightlining Detection
- Get Defensible Screening Built Into Your Next Study
- Sources
- FAQ
What Straightlining Detection Actually Measures
Straightlining, also called non-differentiation, happens when a respondent gives the same or nearly the same answer to every item in a battery, regardless of what each item asks. It shows up most often in grid questions, where a satisficing respondent clicks straight down a column instead of reading each row.
Not all uniform responding looks alike. Researchers generally sort it into three buckets:
- Perfect straightlining: every response in a battery is identical, such as marking “3” on a 10-item satisfaction grid.
- Alternating or patterned responding: a respondent zigzags between two or three values (3, 4, 3, 4) without engaging with item content.
- Low-variance batteries: responses cluster tightly but aren’t fully identical, which can reflect genuine attitudes rather than carelessness.
The harder question is distinguishing plausible from implausible straightlining. A respondent who genuinely feels neutral about ten similar brand attributes might legitimately mark “neither agree nor disagree” across the board. Academic work on this distinction argues that treating all uniform responding as low quality overcorrects: improvements in questionnaire validity can actually produce more uniform, genuinely valid answers, especially when items are worded consistently and measure closely related constructs. The implausible cases are the ones worth flagging, such as identical answers to reverse-worded items that should logically pull in opposite directions.
Straightlining Detection Methods: Indices and Practical Calculations
The long-string index remains the workhorse of straightlining detection, and calculating it is straightforward. For each respondent, scan their answers to a grid or battery and find the longest unbroken run of identical consecutive responses. A respondent who answers “4, 4, 4, 4, 2, 4, 4” has a long-string value of 4, driven by that middle run.
Distribution-based thresholds beat fixed cutoffs almost every time. Method guides commonly cite fixed cutoffs like 8 or 10 identical responses in a row, but that number means something different in a 10-item battery than in a 40-item one. A more defensible approach flags the top 1 to 5 percent of long-string values within your own sample’s distribution, since it adapts to battery length and item difficulty automatically.
Beyond the long-string index, variance and standard deviation across a battery offer a complementary check. A respondent with near-zero variance across 15 items, even without one dominant run, still shows a flat response pattern worth reviewing.
Response time matters too. There’s no universal seconds-based cutoff for speeding. Instead, set the threshold relative to your sample, typically under one-third to one-half of the median completion time for the full questionnaire.
A practical decision flow looks like this:
- Compute the long-string index for every respondent and flag those in the top tail of your sample’s distribution.
- Cross-check flagged cases against completion time, attention-check performance, and open-text quality.
- Inspect device type and mode, since smartphone respondents show measurably different straightlining rates on some battery formats.
- Apply your pre-registered exclusion rule only when multiple indices agree.
Skipping straight from step 1 to exclusion is where most screening protocols lose credibility.
Interpreting Flags: When to Exclude, When to Investigate
A long-string flag by itself tells you almost nothing about intent. It might mean careless responding, or it might mean a respondent with a genuinely flat opinion on ten closely related items. Method guides are blunt on this point: straightlining is necessary but not sufficient for exclusion, and defensible screening always looks for convergent evidence before removing a case.
Convergent evidence means stacking signals. A respondent who straightlines an entire grid and finishes the survey in under a third of the median completion time and writes gibberish in an open-text box presents a much stronger case for exclusion than one who straightlines alone. Any single indicator can have an innocent explanation; three pointing the same direction rarely do.
Before deleting anything, build a short manual review checklist:
- Does the flagged respondent fail a formal attention check, not just the long-string index?
- Is completion time abnormally fast relative to the sample median?
- Does open-text input show nonsense, copy-pasted text, or blank responses where detail was expected?
- Does the pattern hold across multiple batteries, or is it isolated to one difficult grid?
Document every decision. Pre-registering your screening indices and thresholds before fielding, then keeping an audit trail showing each excluded case’s diagnostics, protects the integrity of your findings if a client or peer reviewer ever asks how exclusions were decided.
Pro Tip: Keep flagged-but-retained cases in a separate coded column rather than deleting rows outright. It lets you run your analysis both ways and report the sensitivity of your findings to the screening decision, which reviewers increasingly expect.
Questionnaire and UX Fixes to Reduce Straightlining
Grids invite straightlining because they let a disengaged respondent fall into a mechanical clicking pattern without processing each item. The fix isn’t always “eliminate every grid,” but it does mean using them sparingly and only when items are short and closely related.
A few design changes measurably cut down on implausible straightlining:
- Break long grids into single-item presentations, especially for constructs where item content varies meaningfully.
- Mix scale directions and include reverse-worded items so a careless respondent produces detectable inconsistency.
- Keep batteries shorter. Fatigue climbs fast past 10 to 12 rows, and so does satisficing.
- On mobile, widen tap targets and reduce the number of visible rows per screen, since smartphone respondents show different straightlining patterns than desktop respondents on the same battery.
- Randomize item order where the construct allows it, to prevent position-based response habits from forming.
- Use open-text prompts strategically, not on every screen, since overuse causes its own fatigue-driven low-quality input.
Our matrix question design guide walks through exactly when a grid is worth the risk and when a single-item format serves you better. Broader survey design practices covering item wording and instrument length reinforce the same principle: design decisions made before fielding prevent more bad data than any cleaning step after the fact.
Veridata Insights’ Approach to Defensible Screening
We built our screening architecture, which we call The Fence, around exactly the layered logic this article describes: no single indicator gets a respondent removed on its own. The three layers work together, checking response patterns, timing, and engagement signals before a case is ever flagged for review.
In practice, that means our teams handle:
- Survey programming and consultation built with long-string and speeding checks embedded from the start, not bolted on after fielding.
- Respondent recruitment practices that reduce panel-driven satisficing before it ever reaches your dataset.
- Open-text coding and review that catches the qualitative side of careless responding automated checks miss.
- Documented audit trails showing exactly which rule flagged each excluded case, and why.
Clients get reproducible code and pre-registered screening rules they can hand to a peer reviewer without a second thought.
What Straightlining Detection Looks Like in Practice
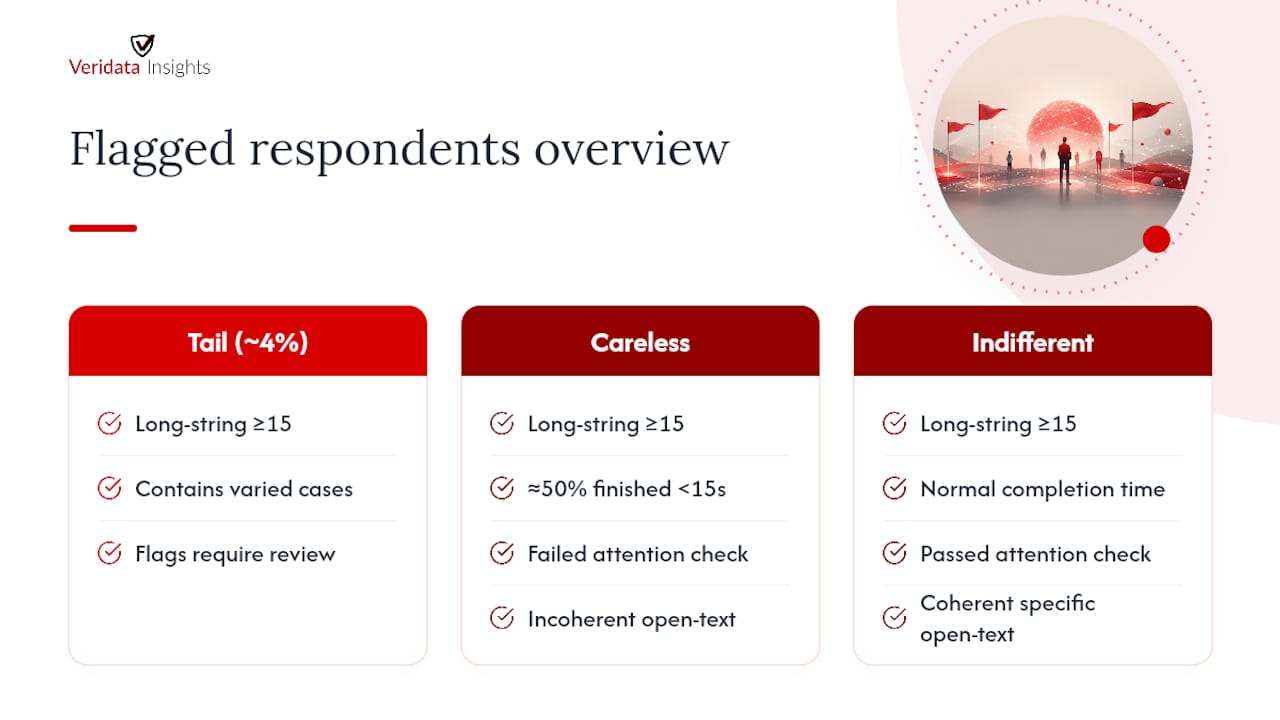
Picture a 20-item brand-attitude grid fielded to 800 respondents. Running a long-string index across the sample turns up a distribution where most respondents show a longest run of 2 to 4 identical answers, which is normal for closely worded items. A tail of roughly 4 percent of the sample shows long-string values of 15 or higher, essentially answering the entire grid the same way.
That tail is where convergent evidence earns its keep. Cross-checking those flagged respondents against completion time shows half of them finished the entire 20-item grid in under 15 seconds, well below a third of the sample median. A handful also failed a planted attention check reading “select ‘strongly disagree’ for this item.” That combination, extreme long-string plus speeding plus a failed check, makes for a defensible exclusion case.
But a smaller subset of the flagged tail tells a different story. Those respondents took a normal amount of time, passed the attention check, and wrote coherent, specific answers in the open-text follow-up. Their straightlining likely reflects genuine indifference toward ten similarly worded brand attributes rather than carelessness. Excluding them on long-string alone would have quietly removed real signal, not noise.
The lesson generalizes: the index does the flagging, but the surrounding data does the deciding. Teams that skip the second step tend to either over-exclude, shrinking their usable sample and skewing results toward more engaged respondents, or under-exclude, letting genuinely careless data distort means and correlations. Neither failure shows up cleanly in a summary table. It shows up later, when results don’t replicate.
Cleaning Data Once Straightlining Is Confirmed
Once convergent evidence confirms a case is genuinely careless, how you handle it in the dataset matters almost as much as the detection itself. The cleanest approach keeps three parallel records: the full raw dataset, a coded flag column marking why each case was identified, and a final analysis dataset with exclusions applied.
Never overwrite raw data. Analysts who delete flagged rows directly from the source file lose the ability to run sensitivity checks later, and they lose the paper trail a client or journal reviewer might request. Instead, add a categorical flag, such as “long-string only,” “long-string plus speeding,” or “long-string plus attention-check failure plus speeding,” so the severity of evidence for each exclusion is visible at a glance.
For borderline cases where evidence is mixed, consider a weighted approach rather than a binary keep or drop decision. Some teams run their core analysis twice, once with the full sample and once with flagged cases removed, and report whether conclusions shift meaningfully between the two. If results hold steady either way, that stability itself is worth reporting.
Timing matters too. Screening during data collection, not only afterward, lets you catch a problematic panel source or a broken mobile layout early enough to fix it mid-field rather than discovering the damage after the close date. Our data cleaning QA checklist lays out a repeatable process for this, including how to structure the audit trail so every exclusion decision survives a client’s or reviewer’s second look.
Beyond the Long-String Index: Other Metrics Worth Tracking
The long-string index catches the most obvious form of straightlining, but it misses patterned responding that alternates between two or three values without ever running long enough to trigger a long-string flag. Response variance and standard deviation across a battery fill that gap, since a respondent who alternates 2, 4, 2, 4, 2, 4 will show near-zero variance despite never repeating the same answer twice in a row.
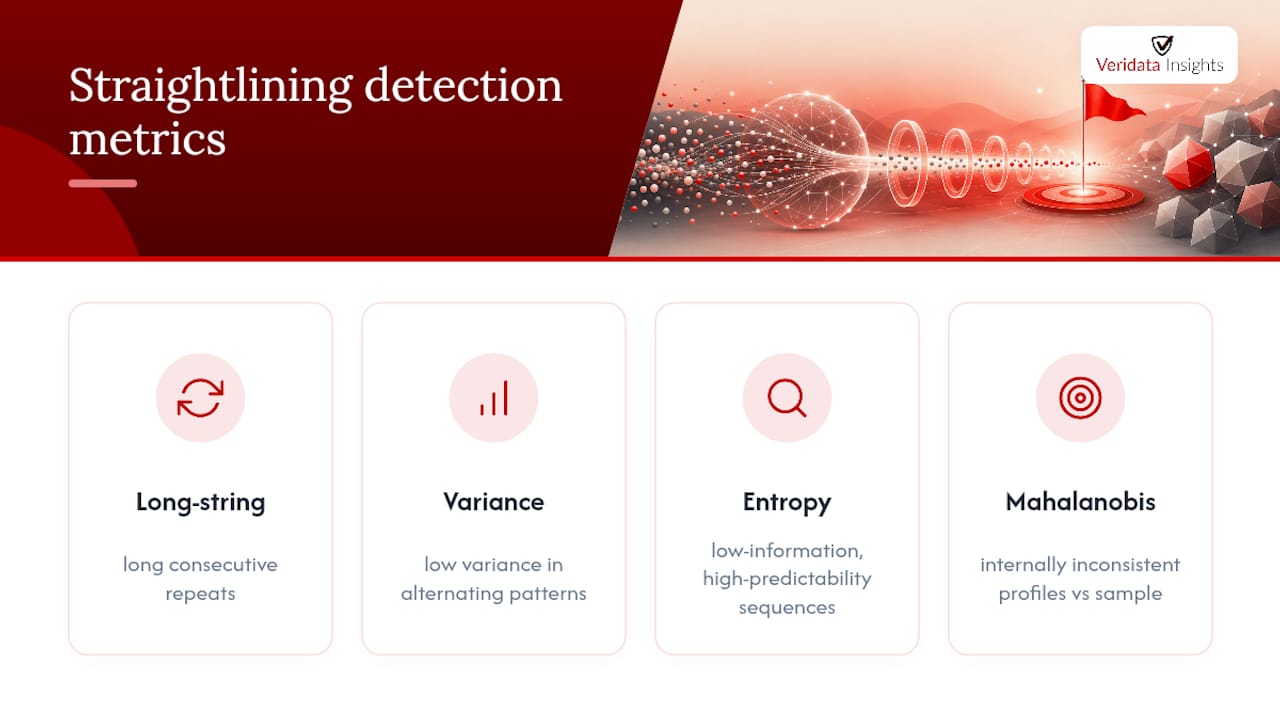
Entropy-based measures offer a more sensitive alternative. Rather than counting consecutive repeats, entropy scores the overall predictability of a respondent’s answer sequence across the full battery, flagging low-information patterns even when they’re too varied for a long-string index to catch. These measures take more computational setup than a simple run count, which is likely why they show up more often in academic methods papers than in day-to-day survey platforms.
Mahalanobis distance and other multivariate outlier statistics catch a different problem entirely: response profiles that are internally inconsistent relative to the rest of the sample, rather than simply repetitive. A respondent might vary their answers plenty but still produce a profile that doesn’t resemble any coherent attitude pattern in the data.
None of these metrics replaces the long-string index. They supplement it, catching different flavors of low-effort responding that a single-run count structurally cannot see. The practical takeaway for most projects: run the long-string index as your primary sweep, then layer in variance checks for batteries where alternating patterns seem plausible, and reserve entropy or multivariate approaches for high-stakes studies where the cost of a bad exclusion decision is high.
Software and Platforms for Straightlining Detection
Most modern survey platforms include some baseline straightlining detection, typically a long-string flag surfaced in the data export or a built-in quality score. That baseline is a starting point, not a finished screening protocol, since platform-level flags rarely let you set distribution-based thresholds tuned to your specific battery lengths.
Statistical software fills that gap. R packages built for careless-response detection let analysts compute long-string, variance, and Mahalanobis distance in a single reproducible script, which matters enormously when a pre-registered protocol needs to be handed to a client or co-author exactly as specified. Python’s data analysis libraries support similar custom scripting for teams that prefer that environment.
For teams without in-house scripting resources, working with a full-service research partner shifts the burden of building and validating these scripts to specialists who run the same protocol across hundreds of studies rather than building one from scratch. Our data quality and forensic verification methods resource walks through how these checks fit into a broader forensic QA process, including digital fingerprinting and duplicate detection that complement straightlining screens.
Whichever tool you choose, the platform matters less than whether your thresholds are documented and reproducible. A quality score buried in a dashboard, with no visible calculation logic, is far harder to defend to a skeptical reviewer than a script that shows exactly how each threshold was set.
Get Defensible Screening Built Into Your Next Study
Reading about long-string thresholds is one thing. Running a pre-registered, multi-index screening protocol across a live field period, with an audit trail a peer reviewer won’t question, is another. That’s the gap Veridata Insights closes for research teams who need defensible data without building a forensic QA function in-house.
We handle straightlining detection as one layer inside a broader full-service market research engagement, covering everything from questionnaire review and survey programming to respondent recruitment and final reporting. There are no project minimums, and we work 365 days a year, so a screening protocol built for one study can be reused and refined across your next one without renegotiating scope from zero. Whether your project leans quantitative with large grid batteries or qualitative with open-text coding needs, our teams build the pre-registered rules and documented audit trail into the project plan from day one.
If your last study left you second-guessing which respondents to trust, reach out to discuss your next project and see how a forensic screening layer fits your timeline and budget.
Sources
For deeper methods detail, the CASRAI guide to detecting careless responding covers long-string calculation and convergent-evidence protocols. The Konstanz methods paper unpacks valid-versus-invalid straightlining, and the GESIS Panel study tests format and device effects directly.
- Detecting Careless Responding: Straightlining, Speeding, and Attention Checks
- Valid vs. Invalid straightlining: The complex relationship between straightlining and data quality
- Straightlining prevalence across domains of social media use …
FAQ
What Does Straightlining Mean in Survey Research?
Straightlining means a respondent gives the same or nearly identical answer to every item in a grid or battery, regardless of what each item asks. Researchers detect it primarily through the long-string index, which measures the longest run of identical consecutive responses.
What Is Straightlining in Survey Responses, and Is It Always Bad?
Straightlining isn’t automatically a data quality problem. Some batteries with closely related items legitimately produce uniform answers from engaged respondents, and research on plausible versus implausible straightlining shows that higher-validity questionnaires can actually increase genuine uniform responding.
Does “Straightlining” Mean Anything Different Outside Survey Research?
Yes. In skiing, straightlining refers to pointing the skis directly downhill without turning to control speed, an unrelated athletic term that shares only the name with the survey methods concept. This article addresses the survey research meaning exclusively.
How Do You Set a Threshold for Flagging Straightlining?
Distribution-based thresholds, typically flagging the top 1 to 5 percent of long-string values within your own sample, are generally more defensible than fixed cutoffs like 8 or 10 identical answers. A fixed cutoff ignores how battery length and item similarity change what counts as suspicious.
Should You Delete Every Flagged Straightliner From Your Dataset?
No. Straightlining alone is not sufficient grounds for exclusion; defensible practice requires convergent evidence, such as a long-string flag combined with speeding or a failed attention check, before removing a case.
Does Veridata Insights Offer Straightlining Detection as a Service?
Straightlining screening is built into Veridata Insights’ full-service market research engagements as part of a broader data quality process. Pricing depends on project scope and is available directly through the site.