Cluster analysis discovers naturally occurring customer or market groups hiding inside your data, and it does it without being told what to look for. That’s the unsupervised part: no predefined labels, no assumptions about who belongs where. The algorithm just finds the structure, and marketers use that structure to build targeted campaigns, price tiers, and product positioning that actually match how customers behave.
Before you pick a method, run a quick reality check. The Hopkins statistic tells you whether your data has real cluster structure at all or is just noise. BIC helps you compare model-based solutions when you’re choosing between competing numbers of segments. And a firm like Veridata Insights exists precisely because getting from raw survey or transaction data to a validated, actionable segmentation involves a dozen decision points most teams don’t know to look for.
Here’s the short version for picking a starting algorithm family:
- Partitioning methods (K-means, K-medoids) for numeric behavioral data like spend, frequency, and recency.
- Model-based methods (Gaussian Mixture Models, Latent Class Analysis) for choice data, conjoint results, or heavily categorical survey responses.
- Density-based methods (DBSCAN) when your customer base has irregular shapes, outliers, or you don’t know how many segments to expect going in.
This is a playbook, not a software tutorial. You won’t find code here. You’ll find the decisions that determine whether your segmentation actually changes how your team markets, or just becomes a slide deck nobody opens again.
Key Takeaways
Effective cluster analysis in marketing depends on testing multiple algorithms, validating stability across resampled runs, and designing every segment around a specific, actionable marketing decision.
| Point | Details |
|---|---|
| Test cluster tendency first | Run a Hopkins statistic or VAT check before investing analyst time in a full segmentation project. |
| Never trust a single algorithm run | Compare at least two structurally different methods and confirm results align before committing. |
| Validate with multiple metrics | Combine silhouette, Davies-Bouldin, and stability testing rather than relying on one score. |
| Build scoring rules before launch | Design a classifier or conservative rule for assigning new customers, since not all features exist at signup. |
| Partner with Veridata Insights for full-service support | Veridata Insights runs pilot and full segmentation programs with multi-method testing, validation, and CRM deployment support. |
Table of Contents
- Why Marketers Use Cluster Analysis Techniques
- Which Clustering Algorithm Fits Your Marketing Data?
- How Do You Prepare Marketing Data for Clustering?
- How to Perform Cluster Analysis: A Step-by-Step Process
- How Do You Choose the Number of Clusters?
- Turning Clusters Into Campaigns That Actually Run
- What Mistakes Undermine Cluster Analysis Results?
- Tools for Exploratory Analysis Through Production Scoring
- How Veridata Insights Runs a Segmentation Project
- Ready to Build a Segmentation That Actually Ships?
- Frequently Asked Questions
- Sources
Why Marketers Use Cluster Analysis Techniques
Cluster analysis pays off because it turns a messy customer base into groups you can actually act on. The technique partitions data into subgroups where members resemble each other and differ from other groups, and marketers lean on it for customer segmentation, product positioning, and campaign optimization.
The most common marketing applications include:
- Customer lifetime-value segmentation — grouping customers by long-term revenue potential rather than a single transaction.
- Persona discovery — finding the natural archetypes inside your customer base instead of inventing them in a workshop.
- Campaign targeting — matching creative and offers to groups that respond to different triggers.
- Product positioning — identifying which features matter to which buyer segment.
- Churn-risk grouping — spotting behavioral patterns that precede cancellation or drop-off.
- Pricing clusters — finding groups with different price sensitivity for tiered offers.
- Channel segmentation — matching outreach (email, SMS, paid social) to the channels each group actually uses.
A B2B software company might discover that its buying committees split into three clusters: technical evaluators who read documentation first, budget owners who respond to ROI calculators, and end users who care about ease of onboarding. An ecommerce retailer often finds a much simpler but equally useful split between repeat buyers who respond to loyalty perks and casual buyers who only respond to discounts. Neither insight comes from demographics. Both come from behavior.
Clustering earns its keep when you’re trying to move response rate, conversion lift, or retention rate, and you don’t already have a clean rule that separates your customers.
It’s the wrong tool in a few specific situations. If your sample is small (say, under a few hundred customers with sparse behavioral history), the clusters you find are more likely to reflect noise than reality. If a rule-based cohort already captures the decision logic, like “anyone who spent over $500 in the last quarter,” you don’t need an algorithm to rediscover what you already know. And if you have a specific outcome you’re trying to predict, like whether someone will churn in 30 days, a supervised model built to predict that exact outcome will usually outperform a general-purpose segmentation.
Which Clustering Algorithm Fits Your Marketing Data?
Different algorithms impose different assumptions on your data, and that choice matters more than most marketers realize. K-means assumes clusters are compact and roughly round. Single-linkage hierarchical clustering can trace out chains or spirals that k-means would completely miss. Neither is universally right. As one methodology overview puts it, algorithms impose structure on data rather than simply revealing it, which is why the smartest marketing analysts test more than one method before committing.
Here’s how the major families stack up for marketing use:
| Algorithm family | Best for | Advantages | Common pitfalls |
|---|---|---|---|
| K-means | Numeric behavioral data (spend, frequency, visits) | Fast, scalable, easy to explain to stakeholders | Forces round, similarly sized clusters even when real groups aren’t shaped that way |
| K-medoids | Numeric or mixed data with outliers | More resistant to extreme values than k-means | Slower on large datasets; still assumes a fixed number of clusters upfront |
| Hierarchical (Ward/linkage) | Small-to-medium datasets where you want to explore multiple cluster counts | No need to pick k in advance; dendrograms show nested structure | Single linkage can chain unrelated points together; computationally heavy at scale |
| DBSCAN | Irregular customer shapes, noisy data with real outliers | Finds arbitrary shapes; doesn’t force every point into a cluster | Struggles with varying density across segments; sensitive to parameter tuning |
| Gaussian Mixture Models | Overlapping segments where soft membership makes sense | Produces probability of belonging to each cluster, not a hard label | Assumes underlying distributions; can be unstable with sparse data |
| Latent Class Analysis | Categorical survey data, choice or conjoint indicators | Estimates membership probabilities alongside segment profiles | Requires larger samples for stable classes; interpretation demands statistical fluency |
Pro Tip: Run at least two structurally different algorithms on the same dataset before you trust a solution. If k-means and a model-based method like LCA point to roughly the same groupings, you’ve found something real. If they diverge sharply, the disagreement itself is diagnostic; it tells you the structure in your data is more ambiguous than a single output suggests.
For high-dimensional behavioral data, like clickstream logs with hundreds of engineered features, autoencoders and other representation-learning approaches can compress the data before a traditional algorithm clusters it. That’s a heavier technical lift, and most marketing teams only need it when working with genuinely large, complex behavioral datasets.
How Do You Prepare Marketing Data for Clustering?
Preprocessing is where most segmentation projects succeed or fail, long before anyone touches an algorithm. A robust cluster-analysis process requires preprocessing, algorithm selection, and validation in that order, and skipping the first step is the fastest way to produce clusters that look scientific but mean nothing.
Start with the boring but essential work:
- Clean at the record level — remove duplicate customer records, standardize identifiers across systems, and sessionize behavioral logs so each row represents a meaningful unit of activity.
- Engineer marketing-relevant features — recency, frequency, and monetary value (RFM) scores, product affinity indexes, and choice-based indicators from surveys or conjoint exercises tend to outperform raw transaction counts.
- Scale and normalize — behavioral variables often live on wildly different ranges (dollars vs. visit counts vs. days since last purchase), and unscaled inputs let one variable dominate the distance calculation.
- Encode categorical variables carefully — one-hot encoding works for low-cardinality fields, target encoding can help with high-cardinality categories, and ordinal encoding fits naturally ranked variables like loyalty tier.
- Handle mixed data types deliberately — when your dataset blends numeric and categorical fields, Gower distance or a model-based method like LCA usually handles the mix better than forcing everything into one distance metric.
- Impute or isolate missing values — decide upfront whether missing data gets imputed, whether sparse long-tail SKU features get grouped into broader categories, and whether extreme outliers get capped, removed, or clustered separately.
None of this is glamorous. All of it determines whether the segments you build next month actually hold up when a new batch of customers hits your CRM.
How to Perform Cluster Analysis: A Step-by-Step Process
A repeatable process protects you from the single biggest failure mode in segmentation work: treating clustering as a one-off black box. Studies of applied segmentation find that k-means and Ward’s method dominate practice, yet many projects never repeat the run or test parameter sensitivity, which means nobody actually knows if the result is stable.
Follow this sequence:
- Define the objective and success metric. Decide upfront whether you’re optimizing for campaign response, retention, or pricing strategy. The objective shapes which features matter.
- Design the sample and extract data. Pull a dataset large enough to support the number of segments you expect, with enough history to capture real behavior patterns.
- Engineer features. Build the RFM scores, affinity indexes, and categorical indicators discussed earlier.
- Test cluster tendency before committing. Run a Hopkins statistic or visual assessment (VAT) check; a value near 0.5 suggests your data may lack real cluster structure, while lower values indicate genuine tendency toward clustering.
- Select candidate algorithms and a parameter grid. Choose two or three structurally different methods and a range of k values or model complexities to test.
- Run repeated trials with different seeds. Initialization matters more than most analysts assume, especially for k-means.
- Choose the number of clusters using multiple criteria. Never rely on a single metric.
- Validate internally and externally. Check statistical fit, then confirm the segments make business sense to stakeholders who know the customers.
- Profile and name the segments. Translate cluster centroids into plain-language descriptions marketing teams can use.
- Operationalize. Build a scoring function for new customers and map segment IDs into your CRM.
Stability testing deserves its own attention. Resample your data, rerun the algorithm on each subsample, and compare the resulting groupings. If segment membership shifts wildly between runs, the solution isn’t ready for deployment, no matter how clean the silhouette score looks on any single run.
Deployment brings its own challenge: converting soft, probabilistic assignments into hard operational rules. Most teams set a probability threshold and build a fallback rule for borderline cases rather than trying to preserve the uncertainty downstream.
Pro Tip: Before you brief a vendor or hand this off internally, put together a one-page checklist covering objective, data sources, candidate algorithms, validation criteria, and deployment plan. It forces alignment before anyone touches a dataset, and it’s the single fastest way to catch a mismatched objective before it costs you six weeks of analyst time.
If your end goal is prediction rather than pure description, consider an integrated approach. Market Segmentation Trees jointly optimize segmentation and a response model, which tends to outperform the standard two-step pipeline of “cluster first, model second” when the objective is predicting a specific outcome like purchase likelihood.
How Do You Choose the Number of Clusters?
No single metric tells you the right number of segments. You need several pointing in the same direction before you trust a result.
The elbow method plots within-cluster sum of squared errors against k and looks for the point where adding more clusters stops meaningfully reducing error. The silhouette score measures how well each point fits its assigned cluster versus neighboring ones, ranging from negative one to one. Davies-Bouldin and the Dunn index both evaluate cluster separation and compactness, with lower Davies-Bouldin and higher Dunn values indicating cleaner separation. For model-based methods like GMM and LCA, BIC and AIC penalize model complexity, helping you avoid overfitting to noise by adding classes that don’t generalize.
These metrics disagree more often than beginners expect. The elbow method might suggest four segments while silhouette scores peak at three. When that happens, don’t split the difference arbitrarily. Look at whether the fourth segment in the four-cluster solution is interpretable and different enough from its neighbors to justify the added complexity. If it isn’t, go with three.
Stability testing is the step most teams skip and most regret skipping. Take repeated sub-samples of your data (bootstrapping is the standard approach), rerun your chosen algorithm on each sample, and check whether the same segments reappear with roughly the same characteristics. If a segment vanishes or merges into another group across different sub-samples, it’s not a stable finding, it’s a statistical accident. If it disappears more often than that, fold it into a neighboring segment or drop it.

Model-based approaches carry an extra layer of nuance. GMM and LCA don’t just assign hard labels; they produce posterior membership probabilities for every customer against every class. A drop in BIC from a one-class to a two-class solution often signals genuinely distinct latent preference groups, particularly in conjoint and choice-based research, which argues for segment-specific strategy over a one-size-fits-all approach.
Turning Clusters Into Campaigns That Actually Run
A cluster only matters once it becomes something a campaign manager can act on. Build a segment profile template with five components: demographics, behavioral signals, value metrics, channel preferences, and messaging cues that resonate with that specific group. Skip any of these and the segment stays theoretical.
From there, the activation playbook looks like this:
- Build scoring rules that assign every new customer to a segment the moment they enter your CRM.
- Generate lookalike audiences from your highest-value cluster for paid acquisition campaigns.
- Develop personalized creative themes tied to each segment’s messaging cues rather than a single brand-wide message.
- Prioritize a test-and-learn calendar so each segment gets at least one experiment per quarter.
- Set segment-specific KPIs rather than judging every group against the same conversion benchmark.
Measurement matters as much as activation. Run A/B or holdout tests within each segment rather than across your whole customer base; a lift that looks strong in aggregate can hide the fact that it’s driven entirely by one segment while another shows no movement at all. Track incremental lift, not just raw response, and revisit your segment definitions periodically. Customer behavior drifts, and a segmentation built on last year’s data can quietly stop matching this year’s reality.
One line worth keeping in your back pocket through all of this: build in data minimization from the start, collecting only what you need for segmentation and giving customers clear visibility into how their data shapes their marketing experience.
What Mistakes Undermine Cluster Analysis Results?
Most segmentation failures trace back to a small set of repeatable mistakes, and most of them are catchable before you ship the results.
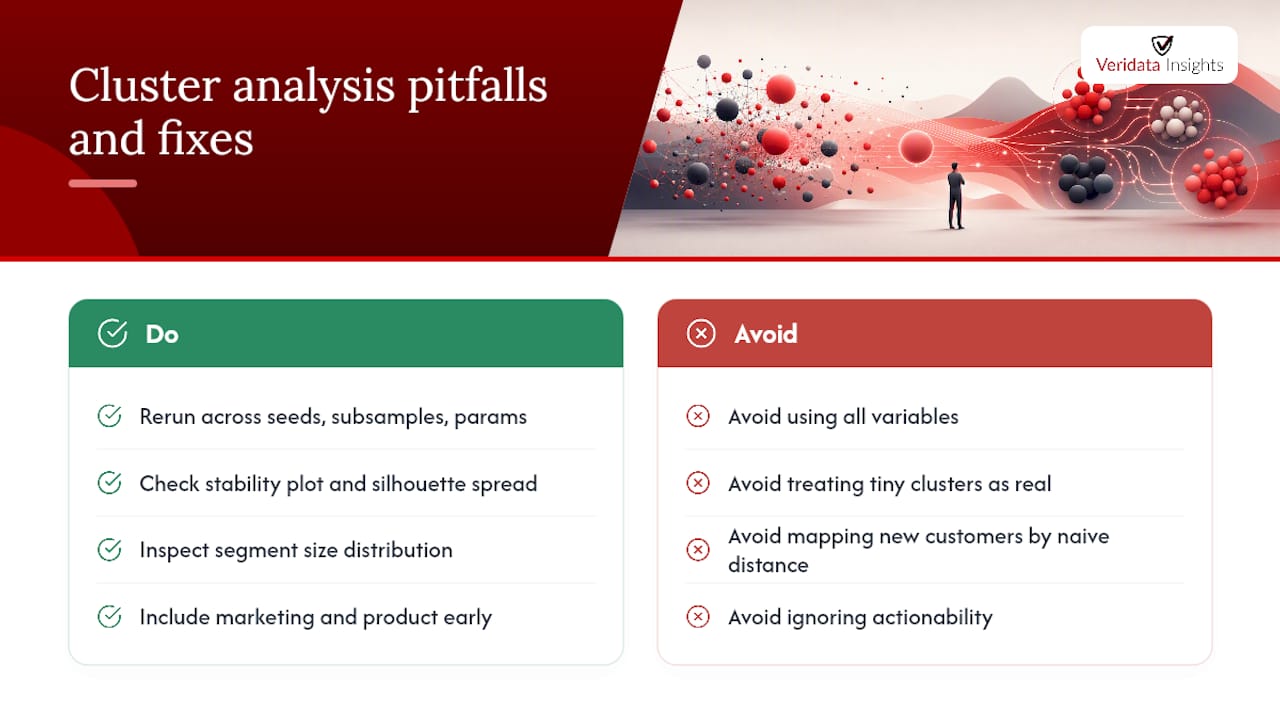
Accepting a single run as final. Practitioners frequently fall into a black-box trap, treating one clustering run as gospel. The fix requires repeating extractions across seeds, sub-samples, and parameter grids, then choosing the solution that’s both stable and interpretable. Ask yourself: did you rerun this with different seeds and get the same segments back?
Poor variable selection. Throwing every available field into a clustering algorithm dilutes the signal from the variables that actually matter. Ask: does each variable in this model have a plausible marketing rationale for driving segment differences?
Ignoring stability entirely. A segmentation that looks clean on one run and falls apart on resampling isn’t ready for deployment. Ask: have you checked the stability plot, or are you trusting a single silhouette score?
Misreading tiny micro-segments. A cluster with 2% of your customer base might be statistical noise, or it might be your highest-value niche. Ask: is this segment large enough to support a dedicated campaign budget, and does its profile make intuitive sense?
Overfitting to noise. Adding clusters until every metric looks perfect usually means you’ve modeled random variation rather than real structure.
Mapping new customers incorrectly. Assigning new records by simple nearest-centroid distance often performs poorly because not all features are available at classification time. Build a discriminative classifier trained to predict segment membership, or design conservative scoring rules for cases with incomplete data.
Failing to align with actionability. A statistically elegant segmentation that nobody in marketing can act on is worse than no segmentation at all.
Run a quick diagnostic pass whenever a result looks suspicious: check the stability plot across resampled runs, review the silhouette distribution rather than just its average, and look at segment size distribution for any group so small it can’t support real campaign activity. And bring marketing, product, and analytics into the room before anything goes live. The algorithm can tell you that a group exists. It takes people close to the business to tell you whether that group is worth building a campaign around.
Tools for Exploratory Analysis Through Production Scoring
The right tool depends entirely on where you are in the project, and conflating exploration with production is a common source of wasted engineering time.
For exploratory work, scikit-learn in Python covers the standard algorithm families: K-means, DBSCAN, hierarchical clustering, and Gaussian Mixture Models, all with consistent APIs that make it easy to test several methods on the same dataset quickly. In R, the cluster package handles K-medoids and hierarchical methods, while mclust specializes in Gaussian mixture and model-based clustering with built-in BIC comparison. For advanced Latent Class Analysis, dedicated statistical software like Latent GOLD or Mplus offers more control over categorical indicator modeling than general-purpose libraries. When data volume grows beyond what fits in memory, Spark MLlib extends several clustering algorithms across distributed compute.
| Stage | Typical tools | Trade-offs |
|---|---|---|
| Explore | scikit-learn, R (cluster, mclust), notebook environments | Fast iteration, easy visualization, not built for repeated production runs |
| Prototype | Python/R scripts with version control, lightweight dashboards | Bridges exploration and deployment; still manual, needs engineering handoff |
| Production | Containerized scoring jobs, Spark MLlib for scale, API integration into CRM | Requires monitoring, scheduled retraining, and drift detection; heavier engineering lift |
Integration with CRM and marketing automation platforms comes down to three practical decisions: how you assign and store segment IDs, how often you refresh scores as customer behavior changes, and how you monitor for segment drift so a stale segmentation doesn’t quietly guide campaigns for months after the underlying behavior has shifted. Teams building B2B segmentation strategies often find the categorical, relationship-driven nature of B2B data pushes them toward model-based methods like LCA rather than simple distance-based clustering.
How Veridata Insights Runs a Segmentation Project
We built our segmentation methodology around one principle: a cluster is only as good as the decisions it drives. That means every project starts with a scoping conversation about what marketing decision the segmentation needs to support, not just what data happens to be available.
Our process runs end to end:
- Scoping and objectives — we define upfront whether you need segmentation for targeting, pricing, positioning, or churn prevention.
- Data and questionnaire audit — we review what you already have and flag gaps before any modeling starts.
- Feature engineering — behavioral aggregates, RFM scores, and category-specific indicators tailored to your business.
- Multi-method clustering experiments — we test at least two structurally different algorithm families rather than committing to one at the outset, the same discipline the comparison of distance-based versus model-based approaches recommends for consulting-grade research.
- Validation and stability testing — resampling, multiple metrics, and a stability threshold before any segment gets named.
- Profiling and deployment support — translating statistical output into segment names and scoring rules your team can use immediately.
What you get at the end: a methodology report explaining every decision, segment definitions with scoring rules, dashboards and visualizations, a recommended activation plan, and a full technical handover including a data dictionary and scoring code.
A pilot segmentation typically runs several weeks, and a full program including CRM integration and activation planning takes longer. Every deliverable passes through a quality-control checklist: repeatability across runs, full documentation of parameter choices, and stakeholder sign-off before anything ships to your marketing team.
Our team, led by Daniel, has run segmentation projects across B2B, B2C, healthcare, and other hard-to-reach audiences. Case study summaries and client feedback are in development for publication here as projects complete.
Ready to Build a Segmentation That Actually Ships?
You’ve seen what it takes to build a segmentation that survives contact with real campaigns: careful preprocessing, multiple algorithms, stability testing, and a deployment plan that doesn’t fall apart the moment a new customer walks in. Veridata Insights runs exactly that process, and we do it as a full-service partner rather than handing you a slide deck and disappearing. Whether you need a pilot segmentation to test the waters, a full program with CRM integration, or a targeted project for a hard-to-reach B2B or healthcare audience, we scope it around your objective from day one, with no minimum project size holding you back.
Getting started is straightforward:
- Book a scoping call to walk through your data and business objective.
- Request a sample deliverable so you can see how we structure segment profiles before committing.
- Run through our data readiness checklist to identify gaps before the project kicks off.
From there, expect a proposal scoped to your timeline, whether that’s a focused four-week pilot or a full twelve-week program with activation support built in. Reach out through our contact page to start the conversation.
Frequently Asked Questions
What is cluster analysis in marketing, in one sentence?
Cluster analysis is an unsupervised statistical technique that groups customers or markets into subsets based on shared characteristics, without relying on predefined labels, so marketers can target each group with tailored messaging and offers.
How is cluster analysis different from basic market segmentation?
Traditional segmentation often relies on predefined categories like age or income bracket. Cluster analysis marketing techniques instead let the data reveal groupings based on actual behavior, which frequently uncovers segments a manual approach would miss entirely.
Which algorithm should I start with for customer segmentation?
Start with K-means if your data is mostly numeric behavioral data like spend and frequency. Switch to Latent Class Analysis or Gaussian Mixture Models if you’re working with categorical survey responses or conjoint data.
How many clusters should a marketing segmentation have?
There’s no fixed answer. Use elbow, silhouette, and BIC together, then weigh interpretability and business actionability. Three to six segments is common in practice, but the right number depends entirely on your data and objective.
Do I need a data science team to run cluster analysis, or can I outsource it?
You can do either. Teams with in-house analytics capability can run this using scikit-learn or R packages like cluster and mclust. Teams without that capacity, or those needing recruitment across hard-to-reach audiences, often work with a full-service research partner like Veridata Insights instead.
How often should segments be revalidated?
Customer behavior drifts, so plan to revisit your segmentation at least annually, and sooner if you notice campaign performance within a segment starting to diverge from what the profile predicts.
Sources
The methodology recommendations in this guide draw on peer-reviewed and practitioner sources worth reading directly if you want the underlying statistical detail.
The Charlotte market segmentation review lays out the full methodology checklist referenced throughout this article, including why stability testing and repeated runs matter for avoiding arbitrary clusters.
The Market Segmentation Trees paper from Harvard Business School explains the integrated segmentation-and-response-modeling approach for teams whose objective is prediction rather than description.
The Springer chapter on extracting segments walks through concrete examples of how different algorithms impose different structure on the same dataset, which underpins the multi-method testing recommendation in this guide.
The Latent Class Analysis foundations paper covers the statistical basis for model-based clustering with categorical indicators, useful for anyone working with conjoint or choice-based survey data.
Google’s clustering overview offers a clear, practical explanation of the new-customer mapping problem and why naive nearest-centroid assignment often fails in production.
- What is cluster analysis in marketing?
- Using cluster analysis for market segmentation
- Step 5: Extracting Segments (Springer chapter)
- Market Segmentation Trees (HBS)