
TL;DR:
- A data research analyst specializes in collecting, analyzing, and producing reproducible, publication-ready research outputs. Their role emphasizes study design, statistical modeling, and rigorous workflows, differentiating them from general data analysts and data scientists. Career progression depends on research ownership, technical expertise, and dedication to reproducibility and methodology.
A data research analyst is a specialized professional who collects, analyzes, and prepares data specifically to support research projects and produce reproducible, publication-ready results. The role sits at the intersection of rigorous methodology and technical execution, requiring proficiency in tools like Python, R, and SQL alongside a deep understanding of study design and statistical modeling. Unlike a general business analyst, this professional is accountable for the quality and traceability of every output, from raw data ingestion to final report. If you are hiring for this role or considering it as a career, understanding what separates it from adjacent titles is the most important thing you can do first.
What does a data research analyst actually do?
The core job duties of a data research analyst include planning studies, designing surveys, collecting and preparing data, and producing analytic reports under supervision. That list sounds straightforward, but the execution is anything but. Each task demands precision at every step because errors compound quickly in research pipelines, and a flawed dataset can invalidate months of work.
Here is what a typical week looks like in practice:
- Data collection and preparation: Pulling data from multiple sources, cleaning inconsistencies, and structuring datasets for downstream analysis.
- Statistical analysis: Running regression models, significance tests, and descriptive statistics using Python, R, or SAS.
- Study instrument design: Building surveys, sampling frameworks, and data collection protocols that meet research-quality standards.
- Report generation: Producing charts, tables, and written summaries formatted for publication or stakeholder review.
- Pipeline development: Building and maintaining ETL workflows that automate data movement and transformation across systems.
The Johns Hopkins Department of Health Policy and Management emphasizes reproducible workflows as a core expectation, not a bonus skill. That means every analysis must be re-runnable from scratch, with outputs traceable to specific code versions and raw data files. This is what separates research-grade work from a one-off spreadsheet.
Pro Tip: Before sharing any notebook or script, clear all outputs and run it top to bottom. Notebooks are notorious for out-of-order execution errors that silently break reproducibility.
What skills and qualifications do employers require?
Employers are specific about what they want, and the bar is higher than many candidates expect. Johns Hopkins specifies a Master’s degree as the preferred credential, along with four years of relevant analytics experience that includes complex programming in quantitative research contexts. That combination of education and hands-on experience reflects how demanding the role actually is.
The technical skill set employers consistently require includes:
- Programming languages: Python for data manipulation and visualization, R for statistical modeling, SQL for database querying and management.
- Statistical methods: Regression analysis, survival analysis, Bayesian modeling, and hypothesis testing.
- Reproducible research practices: Version control with Git, documented workflows, and intermediate data storage that balances iteration with traceability.
- Data visualization: Tools like Tableau, ggplot2, or Matplotlib to translate findings into clear, stakeholder-ready visuals.
- ETL and pipeline engineering: Experience building automated data pipelines that ingest, transform, and load data reliably.
Beyond the technical side, Stanford University’s job postings list strong communication skills as mandatory, not optional. A data research analyst who cannot explain a regression output to a non-technical stakeholder is only half as useful as one who can. The ability to write clear progress reports and incorporate feedback from research leads directly affects project outcomes.
A practical roadmap for aspiring analysts: start with SQL and Excel, then build Python skills for data manipulation and visualization, and finally assemble a portfolio of end-to-end projects that demonstrate stakeholder-ready deliverables. That progression mirrors what employers actually test for in interviews.

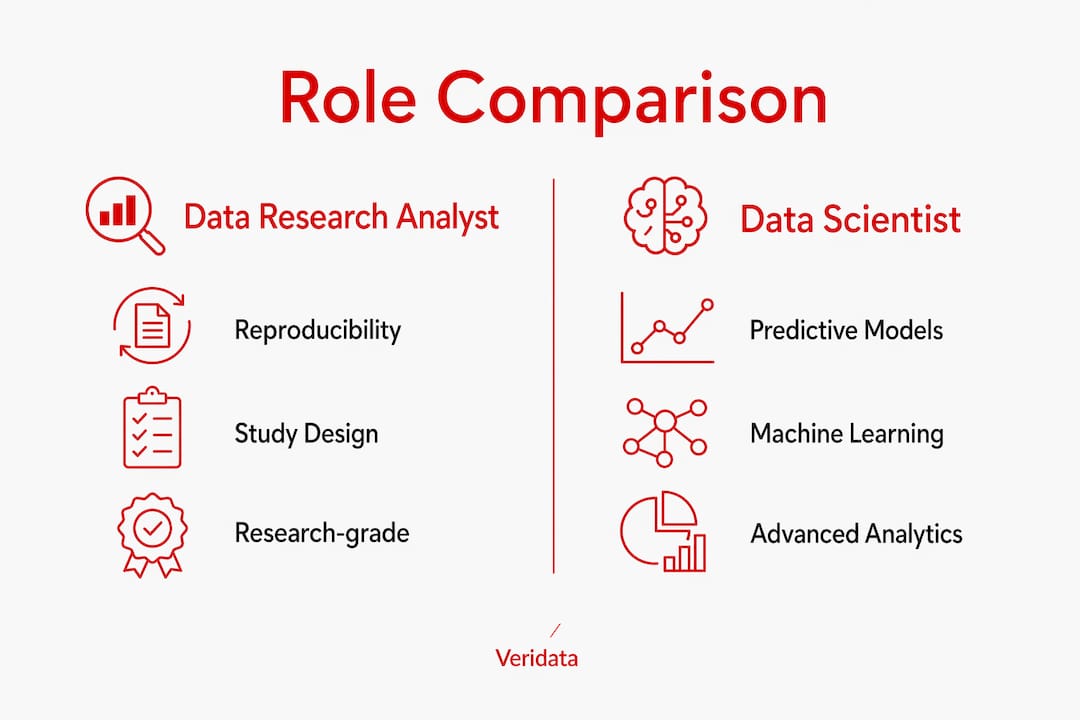
How does a data research analyst differ from a data analyst or data scientist?
This is the question that trips up most hiring managers and job seekers alike. The titles overlap in toolset but diverge sharply in purpose and output expectations.
Data analysts answer what happened and why, while data scientists focus on predictive models and what should happen next. A data research analyst occupies a distinct third lane: producing outputs that meet the standards of academic or institutional research, including reproducibility, auditability, and publication readiness.
| Role | Primary focus | Key outputs | Typical tools |
|---|---|---|---|
| Data analyst | Business performance and operational reporting | Dashboards, KPI reports, trend summaries | SQL, Excel, Tableau, Power BI |
| Data research analyst | Research-grade analysis with reproducible workflows | Study reports, statistical models, publication tables | Python, R, SQL, SAS, Git |
| Data scientist | Predictive modeling and machine learning | Forecasts, recommendation engines, classification models | Python, TensorFlow, Spark, scikit-learn |
The UCnet and Johns Hopkins postings make this distinction concrete. They emphasize study instrumentation design, reproducible research, and detailed reporting as core duties. A standard business data analyst role rarely includes those requirements. If your organization needs research outputs that can withstand peer review or regulatory scrutiny, you need a data research analyst, not a general analyst.
What career paths exist for data research analysts?
Career progression in this field follows a clear arc, and it rewards people who take on more research responsibility over time. Entry-level positions focus on data handling, cleaning, and running pre-specified analyses. Mid-level roles shift toward designing study instruments, managing pipelines, and owning analytic decisions. Senior positions involve leading research programs and mentoring junior analysts.
Here is a realistic progression path:
- Research Data Analyst I: Data preparation, basic statistical analysis, report formatting under close supervision.
- Research Data Analyst II/III: Independent analysis, study design contributions, pipeline development, and stakeholder presentations.
- Senior Research Data Analyst: Full ownership of research protocols, error-sensitive decisions, and cross-functional collaboration with PIs or department heads.
- Research Analytics Manager or Director: Team leadership, methodology oversight, and strategic input on research program design.
Compensation reflects this progression. Stanford lists salaries between $80,148 and $99,773 annually for mid-level roles, while Johns Hopkins entry-level positions start between $48,000 and $84,100. Those ranges signal that specialization pays, especially as analysts take on more complex responsibilities.
The sectors hiring most actively include academia, healthcare systems, public health agencies, consulting firms, and corporate research departments. Each setting has its own flavor: academic roles prioritize publication pipelines, while healthcare and consulting roles emphasize speed-to-insight and data-driven decision making for clients and leadership teams.
Pro Tip: Career advancement ties directly to taking ownership of study design and error-sensitive research decisions. Coding skills get you in the door; research judgment gets you promoted.
Certifications in SAS, Google Data Analytics, or Coursera’s IBM Data Science program can accelerate early-career growth. Building a public portfolio on GitHub that demonstrates reproducible workflows is increasingly a differentiator in competitive applicant pools.
How is AI reshaping the data research analyst role?
AI and automation are changing the job, but not in the way most people fear. Automation handles routine analytical tasks, shifting the analyst’s value toward interpretation, domain expertise, and research design. The people who thrive are those who can direct AI tools rather than compete with them.
The practical shifts happening right now include:
- Automated data cleaning: Tools like OpenRefine and AI-assisted scripts now handle much of the tedious data preparation work, freeing analysts for higher-order tasks.
- Reproducible pipeline automation: Platforms like Apache Airflow and dbt make it easier to build and maintain ETL workflows that run reliably without manual intervention.
- AI-assisted reporting: Large language models can draft initial report narratives from structured outputs, which analysts then review, refine, and contextualize.
- Advanced analytics integration: Techniques like natural language processing and anomaly detection are becoming standard additions to the research analyst’s toolkit, especially in healthcare and B2B research contexts.
The role of data in B2B research is also expanding as organizations demand faster, more granular insights from their research functions. Analysts who understand how to integrate AI-driven analytics into reproducible research workflows will be the most sought-after professionals in the field over the next five years.
The bottom line: AI raises the floor for what counts as basic competency and raises the ceiling for what a skilled analyst can produce. Treat it as a force multiplier, not a threat.
Key takeaways
A data research analyst’s value lies in producing reproducible, research-grade outputs that combine technical rigor with clear stakeholder communication, making the role distinct from both general data analysts and data scientists.
| Point | Details |
|---|---|
| Reproducibility is non-negotiable | Every workflow must re-run from scratch with outputs traceable to code and raw data. |
| Master’s degree preferred | Employers like Johns Hopkins and Stanford expect advanced education plus four years of complex programming experience. |
| Role differs from data analyst | Research analysts design study instruments and produce publication-ready outputs; business analysts focus on dashboards and KPIs. |
| AI amplifies, not replaces | Automation handles routine tasks, shifting analyst value toward interpretation and research design. |
| Career growth requires research ownership | Advancement comes from leading study design and error-sensitive decisions, not just coding proficiency. |
Why reproducibility is the skill most analysts underestimate
I have worked with a lot of research teams, and the pattern is consistent: analysts who treat reproducibility as a checkbox item eventually create expensive problems. A pipeline that runs once and produces a great chart is not a research asset. It is a liability waiting to surface during a client audit or a journal review.
The traceability requirement that all reported figures and tables must link back to specific code scripts and raw data is not academic pedantry. It is the difference between research you can defend and research you have to retract. I have seen organizations lose months of work because a single analyst left without documenting their workflow.
What I tell every team we work with at Veridatainsights: invest in your pipeline architecture before you invest in your visualization layer. A beautiful dashboard built on an undocumented, non-reproducible process is a ticking clock. The analysts who build their careers on solid methodology, clear documentation, and the ability to translate findings for non-technical audiences are the ones who become indispensable. Technical skills are table stakes. Research integrity is the differentiator.
— Daniel
How Veridatainsights supports your data research needs
At Veridatainsights, we know that finding and deploying the right data research analyst capabilities is not always straightforward. Whether you need support designing reproducible research pipelines, building study instruments, or translating complex analyses into stakeholder-ready deliverables, our team is built for exactly that. We work across quantitative and qualitative methodologies, serve B2B, B2C, healthcare, and hard-to-reach audiences, and operate seven days a week with no project minimums. Big research ambitions do not require a big agency. Reach out to our team to discuss your specific data research and analytics needs. We are ready when you are.
FAQ
What is a data research analyst?
A data research analyst is a professional who collects, prepares, and analyzes data to support research projects, producing reproducible and publication-ready outputs. The role requires proficiency in Python, R, and SQL alongside strong study design and statistical modeling skills.
How does a data research analyst differ from a data analyst?
A data research analyst focuses on reproducible workflows, study instrument design, and research-grade reporting, while a data analyst typically produces business dashboards and operational KPI reports. The research analyst role demands higher methodological rigor and auditability.
What qualifications do you need to become a data research analyst?
Most employers prefer a Master’s degree in data science, statistics, public health, or a related quantitative field, plus four years of complex programming experience. Proficiency in Python, R, SQL, and reproducible research practices is standard.
What tools do data research analysts use most?
Python, R, and SQL are the core programming tools, supported by Git for version control, Tableau or ggplot2 for visualization, and pipeline tools like Apache Airflow or dbt for ETL workflow management.
What salary can a data research analyst expect?
Salaries vary by institution and experience level. Stanford lists mid-level roles at $80,148 to $99,773 annually, while Johns Hopkins entry-level positions range from $48,000 to $84,100, reflecting the role’s specialization and growth trajectory.
Recommended
- Data analysis step by step for market researchers in 2026 – Veridata Insights
- Harnessing AI and Advanced Analytics in Market Research for Consulting Firms – Veridata Insights
- Video: Veridata Insights’ Fully Flexible Research Services – Veridata Insights
- Video: Veridata Insights are Research Recruitment Experts – Veridata Insights


