

Many market researchers believe quantitative analysis is purely objective, but understanding its limitations is crucial to achieving truly unbiased insights. The numbers don’t lie, but how we collect, interpret, and apply them certainly can introduce bias. This guide walks you through the foundations of quantitative analysis, clarifies common misconceptions, and provides a practical framework to apply these methods effectively in your market research projects.
Table of Contents
- Understanding Quantitative Analysis: Foundations And Importance
- Why Quantitative Analysis Matters In Market Research
- Common Misconceptions About Quantitative Analysis
- Framework For Applying Quantitative Analysis In Market Research
- Quantitative Data Preparation And Quality Assurance
- Comparison: Quantitative Vs Qualitative Analysis
- Applying Quantitative Analysis: Real-World Market Research Examples
- Bridging Understanding To Practical Application
- Leverage Expert Market Research Solutions With Veridata Insights
- Frequently Asked Questions
Key takeaways
| Point | Details |
| Quantitative analysis relies on numerical data and statistics to generate objective, measurable insights for decision making. | |
| Proper data preparation including cleaning, validation, and outlier management is essential for reliable analysis outcomes. | |
| Quantitative and qualitative methods serve different purposes but complement each other in comprehensive market research. | |
| Common misconceptions about complete objectivity and simplicity can undermine research quality if not recognized. | |
| Following a structured framework from collection through interpretation enhances accuracy and actionable insight generation. |
Understanding quantitative analysis: foundations and importance
Quantitative analysis uses statistical and mathematical techniques to examine numerical data, identifying patterns, trends, and relationships to derive objective insights. At its core, this approach transforms raw numbers into meaningful information that guides strategic decisions. Unlike anecdotal observations or gut feelings, quantitative methods provide measurable evidence you can replicate and verify.
Why does this matter? Quantitative data enables precise measurement and comparison, far more informative than subjective descriptions. When you need to know how many customers prefer Product A over Product B, or whether a marketing campaign increased sales by 15%, quantitative analysis delivers the answers. Statistical and mathematical foundations serve as critical tools that convert abstract questions into concrete, testable hypotheses.
The value extends beyond simple counting. These methods allow you to:
- Test relationships between variables to understand cause and effect
- Predict future outcomes based on historical patterns
- Segment audiences with statistical precision
- Validate assumptions with confidence intervals and significance tests
- Scale insights across large populations from representative samples
For market research professionals, mastering quantitative analysis fundamentals means moving from hunches to evidence. You gain the ability to answer critical business questions with data that stakeholders trust and act upon.
Why quantitative analysis matters in market research
Quantitative analysis minimizes subjectivity and individual bias by relying on objective, numerical data to justify decisions and plans. When you present findings backed by statistical significance rather than personal opinion, you build credibility and confidence among stakeholders. This objectivity becomes especially valuable when making high-stakes decisions about product launches, market entry, or resource allocation.
The ability to test hypotheses transforms vague ideas into actionable insights. You start with a clear question, collect relevant data, apply appropriate statistical methods, and arrive at conclusions supported by evidence. This systematic approach reduces guesswork and helps you identify what actually drives customer behavior, not what you assume drives it.
Key benefits that make quantitative analysis indispensable include:
- Reduction of confirmation bias through structured data collection protocols
- Enhanced replicability allowing other researchers to validate your findings
- Scalability to analyze thousands or millions of data points efficiently
- Precision in measuring small but meaningful differences between groups
- Objective benchmarks for tracking performance over time
Pro Tip: Always document your methodology and assumptions upfront. This transparency not only strengthens your analysis but also helps identify potential biases before they distort your results.
When you partner with experts offering creative market research solutions, you gain access to advanced quantitative techniques without needing to build that expertise in-house. The right support ensures your data collection, analysis, and interpretation meet rigorous standards that deliver quantitative analysis benefits you can actually use.
Common misconceptions about quantitative analysis
Three major misconceptions regularly undermine the quality of quantitative market research. First, many professionals believe quantitative analysis is completely free from bias. The reality? Bias can creep in during survey design, sampling, data collection, and interpretation. Even mathematical models reflect the assumptions and priorities of those who build them. Recognizing these potential biases and working to minimize them through transparent methods is what separates rigorous analysis from misleading numbers.
Second, some researchers dismiss qualitative methods as less rigorous than quantitative approaches. This false hierarchy ignores how both methods serve different purposes and complement each other beautifully. Qualitative research explores the why behind behaviors, generating hypotheses and providing context. Quantitative research tests those hypotheses at scale and measures prevalence. You need both for comprehensive understanding.
Third, there’s a dangerous assumption that quantitative analysis is simple and requires no special skills. In truth, proper statistical analysis demands:
- Understanding which statistical tests apply to your specific data type and research question
- Recognizing when sample sizes are too small for meaningful conclusions
- Interpreting confidence intervals and p-values correctly
- Avoiding common errors like confusing correlation with causation
- Communicating results in ways that prevent misinterpretation
Pro Tip: Before running any statistical test, ask yourself whether you truly understand what the results will tell you and what they won’t. If you’re uncertain, consult with a statistician or experienced researcher.
Misusing quantitative methods leads to erroneous conclusions that can derail entire projects. A poorly designed survey yields garbage data no matter how sophisticated your analysis. Ignoring statistical assumptions produces impressive-looking charts that mean nothing. Taking time to recognize these misconceptions protects you from costly mistakes and builds research that actually informs better decisions.
Framework for applying quantitative analysis in market research
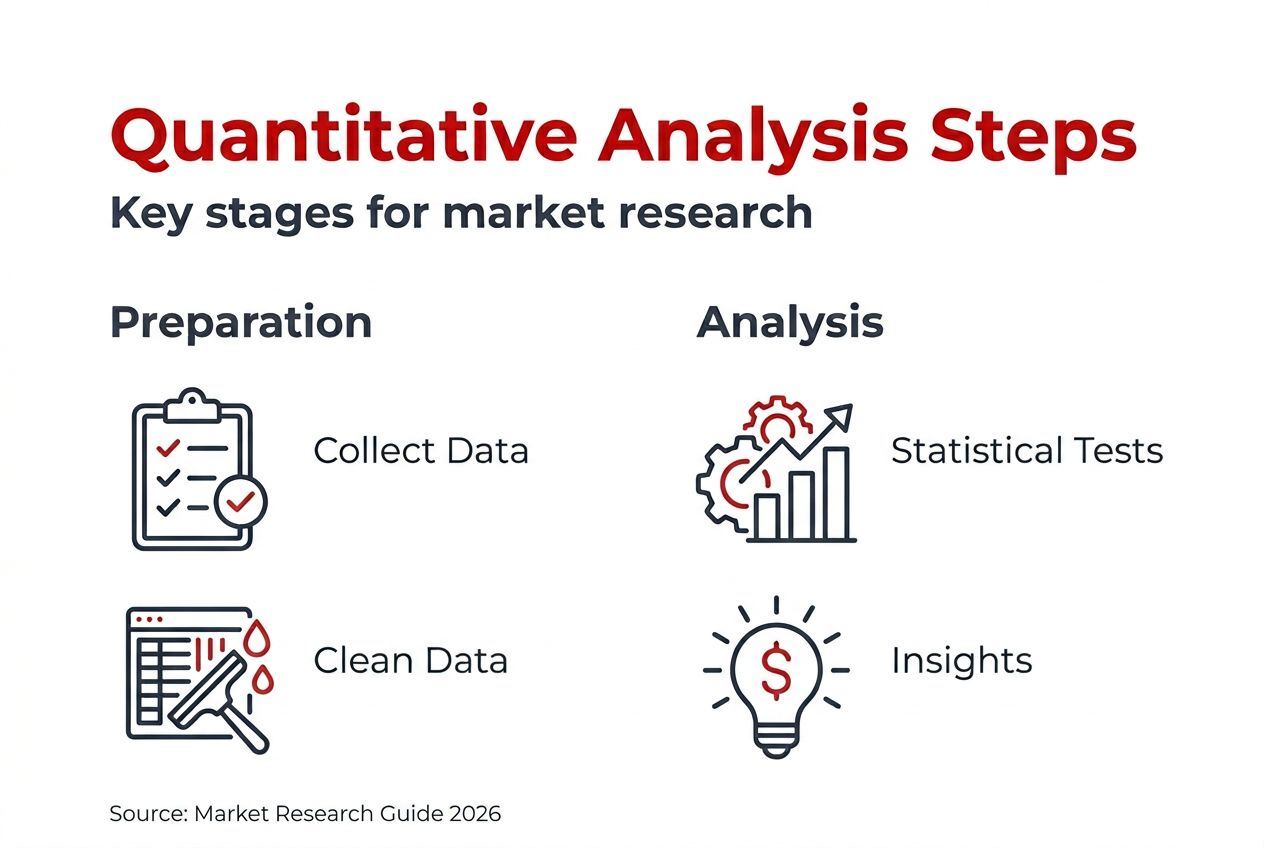
Quantitative analysis can be systematically conducted through a stepwise process: data collection, cleaning and preparation, exploratory analysis, modeling, and interpretation. This framework provides structure while remaining flexible enough to adapt to different research questions and contexts.
Step 1 focuses on data collection with emphasis on gathering relevant numerical information. Define your research objectives clearly before collecting anything. What specific questions need answers? What population are you studying? How large a sample do you need for statistical validity? These decisions shape everything that follows.
Step 2 addresses data cleaning and preparation, the unglamorous work that determines analysis quality. You’ll handle missing values, detect and manage outliers, and standardize data formats for consistency. Skip this step and your sophisticated models will produce sophisticated nonsense.
Step 3 involves exploratory data analysis to uncover initial patterns and relationships. Calculate descriptive statistics, create visualizations, and look for unexpected trends. This exploration often reveals issues requiring additional cleaning or suggests new questions worth investigating.
Step 4 applies modeling and hypothesis testing with appropriate statistical methods:
- Regression analysis to understand relationships between variables
- T-tests or ANOVA to compare groups
- Chi-square tests for categorical data associations
- Time series analysis for trends over time
Step 5 converts statistical results into actionable insights through careful interpretation. What do these findings mean for your business question? What recommendations follow from the data? How confident should stakeholders be in acting on these insights?
Integrating diversity and inclusion in research considerations throughout this process ensures your analysis reflects the full population you serve. Following a structured market research process like this framework increases accuracy and clarity while reducing the risk of overlooking critical steps. The cyclical nature means findings from one project inform and improve the next, building your expertise over time.
Quantitative data preparation and quality assurance
Effective quantitative analysis requires thorough data cleaning including handling missing values, removing outliers, and standardizing data formats to ensure accuracy. Think of data preparation as the foundation of a building. No matter how impressive the architecture, a weak foundation dooms the entire structure.

Handling missing data demands thoughtful decisions. You can’t simply delete all incomplete records without understanding why data is missing. Is it random, or do certain groups systematically skip particular questions? Sometimes imputation makes sense, filling gaps with statistical estimates. Other times, analyzing patterns of missingness reveals insights about survey design or respondent behavior.
Detecting and managing outliers requires balancing two risks:
- Removing legitimate extreme values that represent real phenomena
- Keeping data entry errors or measurement problems that distort results
Statistical methods like z-scores or interquartile ranges help identify outliers objectively. Then you investigate whether they’re genuine or mistakes before deciding how to handle them.
Standardizing data formats improves consistency and enables accurate comparisons. Convert all currency to the same denomination, ensure dates follow one format, and verify that categorical responses use consistent labels. Small inconsistencies multiply across large datasets, creating serious accuracy problems.
Data validation steps increase reliability through systematic checks:
- Range checks ensuring values fall within plausible bounds
- Logic checks verifying that related answers make sense together
- Cross-tabulations revealing impossible combinations
- Duplicate detection identifying multiple submissions from the same respondent
Poor data quality degrades insights no matter how sophisticated your analysis methods. Investing time in preparation pays dividends through results you can trust and defend.
Implementing data quality best practices from the start prevents problems that are expensive or impossible to fix later. Consider data cleaning techniques as essential skills, not optional extras.
Comparison: quantitative vs qualitative analysis
Quantitative analysis differs from qualitative analysis mainly by focusing on numerical data for statistical testing versus textual or observational data for thematic insights. Understanding when to use each approach, or combine both, is crucial for comprehensive market research.
| Aspect | Quantitative Analysis | Qualitative Analysis |
| Data Type | Numerical, structured, measurable | Textual, visual, observational, unstructured |
| Primary Goal | Measure, test, quantify, generalize | Explore, understand, interpret, provide context |
| Sample Size | Larger samples for statistical validity | Smaller, purposive samples for depth |
| Analysis Methods | Statistical tests, modeling, metrics | Thematic coding, narrative analysis, interpretation |
| Outputs | Charts, statistics, predictive models | Themes, quotes, case studies, frameworks |
Quantitative methods excel when you need to answer how many, how much, or how often. They provide the statistical power to generalize from samples to populations and test whether differences or relationships are real or just random chance. If you want to know what percentage of customers would buy a new product or whether satisfaction scores improved after a service change, quantitative analysis delivers.
Qualitative methods shine when exploring why people behave certain ways or how they experience your brand. They generate rich contextual understanding and surface unexpected insights that structured surveys might miss. Use qualitative research to:
- Develop hypotheses before large-scale quantitative testing
- Understand the meaning behind statistical patterns
- Explore sensitive topics requiring nuanced conversation
- Identify new opportunities or problems you hadn’t anticipated
The most powerful market research often combines both approaches. Start with qualitative exploration to understand the landscape and develop relevant questions. Then use quantitative methods to test how widespread those findings are and measure their importance. Finally, return to qualitative research to interpret surprising quantitative results or explore implications.
When comparing market research methods, consider your specific objectives, timeline, and budget. Neither approach is inherently superior. The question is which method, or combination, best addresses your research needs.
Applying quantitative analysis: real-world market research examples
Seeing quantitative analysis in action demonstrates its practical value better than abstract descriptions. Consider a B2B technology company trying to understand which features drive purchase decisions. Through quantitative surveys of 500 potential buyers and conjoint analysis, they discovered that price sensitivity varied dramatically by company size. Small businesses prioritized ease of use over advanced features, while enterprises would pay premium prices for integration capabilities. This insight led to a tiered product strategy that increased conversion rates by 23%.
In B2C contexts, a retail chain used point-of-sale data combined with customer surveys to test whether loyalty program changes would increase spending. Statistical modeling revealed that personalized offers based on purchase history drove 31% higher redemption rates compared to generic discounts. The quantitative evidence gave executives confidence to invest in the technology infrastructure needed for personalization.
Another example involved finding needle-in-a-haystack audiences for a specialized healthcare product. Traditional sampling would have required enormous sample sizes to locate enough qualified respondents. By applying screening algorithms and sequential sampling methods, researchers efficiently identified the target population and gathered statistically valid insights at a fraction of the expected cost.
Key applications across different scenarios include:
- Using regression models to identify which marketing channels deliver the highest ROI
- Applying cluster analysis to segment customers based on behavioral patterns rather than demographics
- Conducting A/B tests with proper statistical rigor to optimize website conversion rates
- Tracking brand health metrics over time to measure campaign effectiveness
- Validating pricing strategies through discrete choice experiments
These examples share common elements: clear research objectives, appropriate methodology selection, rigorous data collection, and careful interpretation that connects statistical findings to business decisions. Enhanced client reporting with quantified insights makes recommendations more persuasive and implementation more confident.
Bridging understanding to practical application
Translating statistical results into actionable business decisions requires more than technical skills. You need to communicate findings in ways that non-technical stakeholders understand and trust. Start by focusing on practical significance, not just statistical significance. A difference might be statistically significant but too small to matter in real-world operations. Conversely, important trends might not reach significance due to limited sample sizes.
Avoiding common pitfalls protects the integrity of your recommendations:
- Never confuse correlation with causation. Just because two variables move together doesn’t mean one causes the other. Test causal hypotheses through experimental designs or advanced modeling techniques.
- Don’t cherry-pick results that support preferred conclusions while ignoring contradictory evidence. Report all findings, including those that complicate the narrative.
- Resist the urge to over-interpret small subgroups. When you slice data into tiny segments, statistical noise overwhelms signal.
- Account for multiple comparisons. Running dozens of statistical tests increases the odds of finding spurious relationships by chance.
Maximizing research impact requires clear reporting that connects data to decisions. Use visualizations that highlight key insights without distorting the underlying data. Provide context that helps stakeholders understand what results mean for their specific challenges. Include confidence intervals and margins of error so decision-makers appreciate the uncertainty inherent in all research.
Leveraging quantitative insights throughout the research lifecycle means:
- Using pilot studies to refine methodology before full-scale data collection
- Monitoring data quality in real time to catch problems early
- Conducting sensitivity analyses to test whether conclusions hold under different assumptions
- Documenting methods thoroughly so future researchers can build on your work
Continuous refinement and validation of findings ensures your analysis remains relevant as conditions change. Markets evolve, customer preferences shift, and competitive landscapes transform. Regular measurement tracks these changes and signals when strategies need adjustment. Whether you access the market research full value chain or leverage flexible research services, the goal remains translating numbers into actions that drive better outcomes.
Leverage expert market research solutions with Veridata Insights
Applying rigorous quantitative analysis to your market research challenges doesn’t mean building an entire analytics team in-house. Veridata Insights specializes in delivering data you trust and service you need, whether you require full-service support or targeted assistance at specific project stages.
Our flexible approach means no project minimums and support available seven days a week, 365 days a year. From consultation and design through data collection, processing, and advanced analytics, we provide comprehensive solutions tailored to your quantitative research needs. Whether you’re navigating complex B2B audiences, challenging healthcare populations, or hard-to-reach consumer segments, our recruitment expertise and methodological rigor ensure quality data that drives confident decisions.
Explore our creative market research solutions to see how we transform research challenges into actionable insights. We handle everything you need or work alongside your team on specific components, providing exactly the support your project requires. Discover how our approach addresses all your market research needs with the expertise and flexibility that maximize your project outcomes. Watch our research process video to see how we deliver quality at every stage.
Frequently asked questions
What is quantitative analysis used for in market research?
Quantitative analysis measures customer preferences, tests hypotheses about market behavior, tracks performance metrics over time, and validates business strategies with statistical evidence. It transforms subjective questions into objective measurements that guide resource allocation, product development, pricing decisions, and marketing strategies. The numerical precision allows you to quantify opportunity sizes, compare alternative approaches, and predict future outcomes with known confidence levels.
How does quantitative analysis differ from qualitative research?
Quantitative analysis uses numerical data and statistical methods to measure and test, providing breadth and generalizability across populations. Qualitative research uses textual, visual, or observational data to explore meanings and contexts, providing depth and nuanced understanding. Neither is superior; they serve complementary purposes. Smart researchers use qualitative methods to generate hypotheses and understand the why, then apply quantitative methods to test how widespread those patterns are and measure their magnitude.
What are the biggest challenges in quantitative analysis?
Three major challenges consistently emerge: ensuring data quality through proper collection and cleaning processes, selecting appropriate statistical methods for your specific question and data type, and interpreting results correctly without overstating conclusions. Many researchers also struggle with sample size determination, balancing statistical requirements against budget constraints. Finally, communicating technical findings to non-technical stakeholders in ways that drive action rather than confusion requires skill that goes beyond statistical knowledge.
Can small businesses benefit from quantitative analysis?
Absolutely. While large corporations might analyze millions of transactions, small businesses gain valuable insights from properly conducted surveys of hundreds of customers or structured analysis of their sales data. The key is asking focused questions, using appropriate methods for your sample size, and recognizing the limitations of your data. Even simple statistical comparisons like tracking conversion rates across marketing channels or comparing customer satisfaction before and after service changes provide actionable insights. Professional support makes advanced techniques accessible regardless of company size.
How do you ensure quantitative analysis remains unbiased?
Start with transparent methodology documenting all decisions about sampling, measurement, and analysis before collecting data. Use validated measurement instruments rather than creating new surveys without testing. Collect data from representative samples using proper randomization techniques. Pre-register your hypotheses to prevent cherry-picking results. Have colleagues review your analysis plan and results to catch unconscious biases. Report all findings, including those that contradict expectations. Remember that complete objectivity is impossible, but transparency about potential biases and systematic processes minimize their impact on conclusions.


