
TL;DR:
- Quantitative data gathering involves systematically collecting numerical information for statistical analysis across various fields. Choosing the appropriate method, such as surveys or experiments, is essential to align with the research question and ensure data reliability and validity. Proper instrument testing, sample size planning, and strategic data preparation are vital for accurate and ethical research outcomes.
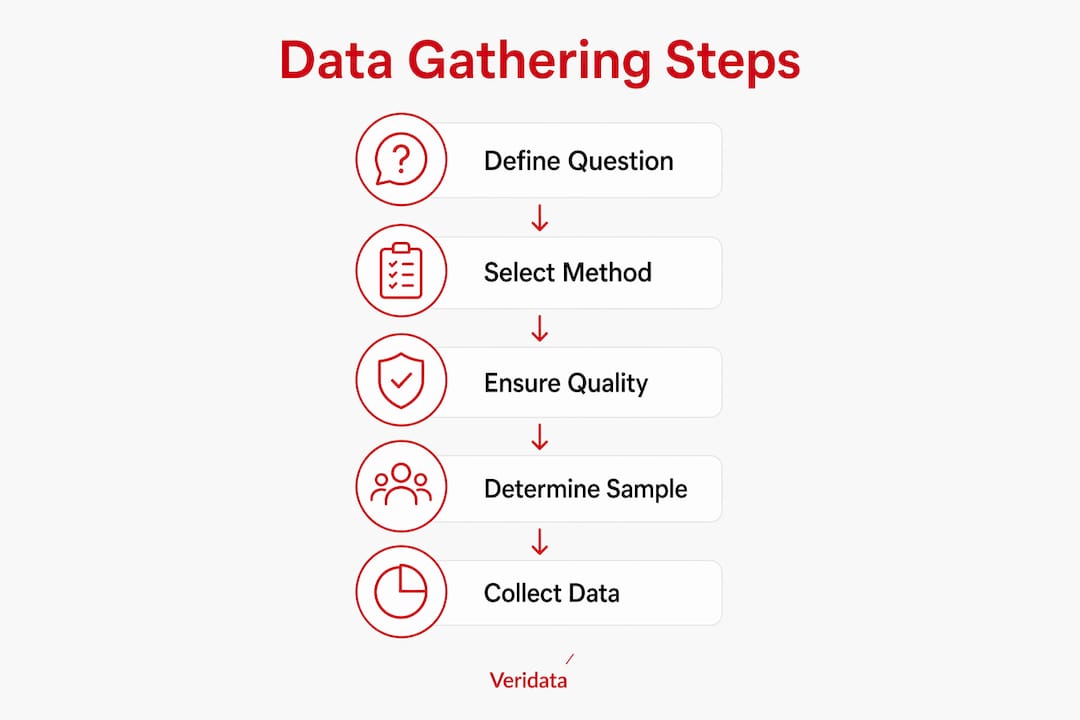
Quantitative data gathering is the structured process of collecting numerical information to measure, compare, and analyze phenomena through statistical methods. In analytics, market research, and academic research, this process is the foundation of every credible finding. Methods like surveys, controlled experiments, and secondary data analysis each produce numeric outputs that feed statistical models and drive decisions. Getting this process right, from instrument design through data preparation, determines whether your results hold up under scrutiny or fall apart at the analysis stage.
What are the primary methods of quantitative data gathering?
Structured instruments such as surveys, structured interviews, experiments, and secondary data analysis produce numeric measurements built for statistical comparison. Each method serves a different research goal, and choosing the wrong one wastes time, budget, and credibility.
| Method | Best Used For | Key Strength |
|---|---|---|
| Surveys and questionnaires | Attitude, opinion, and behavior measurement at scale | Speed and reach across large samples |
| Experiments and A/B testing | Causal inference and treatment effect estimation | Controls for confounding variables |
| Structured observation | Behavioral frequency and duration counting | Captures actual behavior, not reported behavior |
| Secondary data analysis | Leveraging existing datasets like census or CRM data | Cost-effective and historically rich |
| Biometric measurement | Physiological response tracking | Objective, non-self-reported data |
Surveys and structured questionnaires remain the most widely used data collection technique across industries. They scale efficiently and work for both B2B and B2C audiences when designed with precision. Experiments and A/B testing are the gold standard when you need to establish causation rather than correlation. Structured observation is underused in market research but delivers high-value behavioral data that self-report surveys simply cannot replicate.
Matching your method to your research question is not optional. Each method has distinct strengths and limitations that directly affect what conclusions you can draw. A survey can tell you what people say they do. Structured observation tells you what they actually do. That distinction changes everything.
Pro Tip: If your research question asks “why” or “how much,” you need a quantitative method. If it asks “how” or “what does it feel like,” you need qualitative. Mixing them up at the design stage is the most expensive mistake in research.
How do you ensure data quality in quantitative research?
Data quality in quantitative studies rests on two distinct concepts: reliability and validity. A measure can be consistent but still invalid, which means a reliable instrument that measures the wrong construct produces useless data. You need both.

Reliability refers to consistency across repeated measurements. Validity refers to whether you are actually measuring what you intend to measure. Confusing the two is one of the most common mistakes in survey design, and it produces instruments that look rigorous but deliver misleading results.
For multi-item scales, Cronbach’s alpha above 0.7 is the accepted threshold for internal consistency. That number tells you your scale items are measuring the same underlying construct. Internal consistency supports construct validity but does not guarantee it alone. You still need to iterate through item wording and run validation checks to build a measure that holds up.
Here is where most research teams cut corners: pilot testing. Running a full procedure on a small sample before full-scale deployment catches problematic items, confusing wording, and procedural gaps before they corrupt your data. A pilot is not a luxury. It is the cheapest insurance you can buy in research.
Key practices for maintaining data quality include:
- Iterative instrument design: Revise items based on pilot feedback before finalizing the questionnaire.
- Construct validation: Test whether scale items cluster as expected using factor analysis.
- Equivalence testing: Confirm that your instrument performs consistently across subgroups.
- Real-time consistency checks: Build response rules into your data collection platform to flag anomalies during intake.
Pro Tip: Run your pilot on at least 10% of your target sample size. Anything smaller gives you too little signal to detect systematic problems in your instrument.
For deeper guidance on building reliable instruments, the survey methodology guide from Veridata Insights walks through each design stage in practical terms.
What are best practices for sample size and data preparation?
Sample size is not a guess. It is a calculation grounded in your estimand type, expected effect size, and population structure. Cochran’s formula at 95% confidence and 5% margin of error recommends 384 respondents for an unknown population. When your population is smaller, finite population correction reduces that requirement significantly. A population of 500, for example, brings the needed sample down to 217.
Prospective power analysis is the correct tool for sample size planning and must be done at the design stage, not after data collection. Post-hoc power analysis is misleading and widely criticized in the statistical literature. Plan your sample size before you launch, not after you see your results.
Once data is collected, preparation is where studies succeed or fail quietly. Data preparation involves merging, labeling, recoding, exploring distributions, and missing-data strategies. Each step requires documentation so your analysis is reproducible and auditable.
Follow this sequence for data preparation:
- Merge and compile all data sources into a single working file with consistent variable naming.
- Examine distributions for each variable to identify outliers, floor effects, and ceiling effects.
- Recode variables as needed, including reverse-scoring, collapsing categories, and creating composite scores.
- Assess missingness by calculating the proportion of missing values per variable and per respondent.
- Apply a missing data strategy aligned to the missingness mechanism, whether that is listwise deletion, single imputation, or multiple imputation.
Missing data deserves serious attention. Multiple imputation creates multiple completed datasets that reflect the uncertainty from missing values, then pools results using Rubin’s rules to produce unbiased estimates. The number of imputations needed relates to the fraction of missing information (FMI). Higher FMI means more imputations are needed to stabilize inference. Ignoring this relationship leads to confidence intervals that are too narrow and conclusions that are too confident.
What practical and ethical factors shape data collection workflows?
Modern data gathering workflows integrate capture, validation, and analysis sequentially to reduce turnaround time and prevent errors from compounding across stages. Treating these as separate phases with handoffs between teams is the old model. The better approach connects them.
Practical and ethical considerations that every professional should build into their workflow:
- Respondent burden: Keep surveys as short as the research objective allows. Long surveys produce satisficing behavior, where respondents rush through items without genuine engagement.
- Informed consent: Participants must understand what data is collected, how it will be used, and who will access it. This is a legal and ethical requirement, not a formality.
- Bias prevention: Randomize item order where possible, use neutral wording, and avoid leading questions. These choices affect data quality as much as sample size does.
- Real-time validation: Instrument-level validation during data collection catches questionable records during intake rather than after export. Predefined response rules flag out-of-range values, straight-lining, and speeding before they enter your dataset.
- Digital tools and AI assistance: Platforms with built-in logic checks, skip patterns, and quota management reduce human error and speed up fieldwork without sacrificing quality.
Privacy compliance is non-negotiable in 2026. Whether you are collecting data under GDPR, CCPA, or institutional review board protocols, your data collection strategy must document consent, storage, and access controls from day one. Building compliance in after the fact is expensive and sometimes impossible.
For a practical breakdown of how questionnaire design choices affect data integrity, Veridata Insights has published detailed guidance worth reviewing before your next instrument goes into the field.
Key takeaways
Effective quantitative data gathering requires matching your method to your research question, validating your instrument before launch, and treating data preparation as a core part of the research process, not an afterthought.
| Point | Details |
|---|---|
| Method selection matters | Match surveys, experiments, or observation to your specific research question and measurement goal. |
| Reliability and validity are separate | A consistent instrument that measures the wrong construct produces invalid results. |
| Pilot testing is non-negotiable | Run a full procedure on a small sample before fieldwork to catch instrument problems early. |
| Sample size requires prospective planning | Use Cochran’s formula and power analysis at the design stage, not after data collection. |
| Missing data needs a strategy | Apply multiple imputation with Rubin’s rules when missingness is substantial to avoid biased estimates. |
What i’ve learned from years of quantitative research work
The single most persistent mistake I see in quantitative research is treating reliability and validity as interchangeable. They are not. A scale can produce the same score every time and still be measuring the wrong thing entirely. I have reviewed instruments that scored well on Cronbach’s alpha but failed basic face validity checks because the item pool drifted from the original construct. That is a design problem, not a statistics problem.
The second thing I have learned is that pilot testing is where the real work happens. Most teams treat it as a checkbox. The teams that get the most out of their data treat the pilot as a genuine diagnostic. They analyze the pilot data, run item-level statistics, and revise before they ever touch the full sample. That discipline pays off every time.
On missing data, the field has moved decisively toward multiple imputation, and for good reason. Single imputation underestimates variance. Listwise deletion introduces bias when data is not missing completely at random. Monitoring the fraction of missing information and adjusting the number of imputations accordingly is now standard practice in serious quantitative work.
The trend I am watching most closely is the integration of AI-triggered quality monitoring during data collection. Real-time flagging of straight-liners, speeders, and inconsistent responders used to happen post-collection. Now it happens during fieldwork. That shift compresses timelines and improves data quality simultaneously. It is the most meaningful operational change in quantitative data collection workflows in the past several years.
— Daniel
How veridata insights supports your research needs
Veridata Insights delivers full-service quantitative research support, from study design and questionnaire review through data collection, processing, and reporting. Whether you need help planning sample sizes, designing reliable instruments, or managing complex data preparation workflows, the team at Veridata Insights brings the methodology expertise to get it right. There are no project minimums, and the team is available seven days a week. If you are working on a quantitative study and want a research partner who understands the details that matter, reach out to Veridata Insights to discuss your project.
FAQ
What is quantitative data gathering?
Quantitative data gathering is the structured collection of numerical data using instruments like surveys, experiments, and structured observation to enable statistical analysis. It differs from qualitative research by producing measurable outputs that can be compared and generalized across populations.
Which quantitative research method is most widely used?
Surveys and structured questionnaires are the most widely used quantitative data collection method across market research, academia, and analytics. They scale efficiently and produce numeric data suitable for a broad range of statistical analyses.
How do you calculate the right sample size?
Cochran’s formula at 95% confidence and a 5% margin of error recommends 384 respondents for an unknown population. Finite population correction and prospective power analysis refine that number based on your specific study design.
What is the difference between reliability and validity?
Reliability measures consistency across repeated administrations, while validity measures whether an instrument captures the intended construct. A measure can be reliable without being valid, which is why both must be tested independently.
How should you handle missing data in quantitative studies?
Multiple imputation is the recommended approach when data is not missing completely at random. It creates multiple completed datasets and pools results using Rubin’s rules, producing unbiased estimates that account for the uncertainty introduced by missing values.


