

Most teams treat data processing as a technical afterthought. It is not. It is the backbone of every research decision you make, and when it goes wrong, it goes wrong quietly. 40% of project errors in market research trace back to poor data cleaning, and most projects spend 60 to 80% of their total time just preparing data. That is a staggering investment in a phase many organizations rush through. This article gives you a clear, practical roadmap for getting data processing right, from the first collection step to the final insight.
Table of Contents
- Why data processing is crucial in market research
- The essential steps of data processing
- Core methodologies and advanced techniques
- Expert pitfalls and nuances: Handling edge cases
- Adaptive strategies and approaches in data processing
- Applying data processing best practices: A step-by-step guide
- Get expert help with data processing in your market research
- Frequently asked questions
Key Takeaways
| Point | Details |
|---|---|
| Cleaning is critical | Data cleaning consumes most processing time and affects final research quality. |
| Hybrid methods work best | Combining automated tools and manual checks ensures higher data integrity in complex projects. |
| Choose the right strategy | Select deletion, imputation, or winsorizing based on your unique research needs and data quality. |
| Prioritize trusted providers | Work with agencies that follow industry benchmarks and ESOMAR guidelines for superior results. |
Why data processing is crucial in market research
Data processing, in the market research context, is every action taken to transform raw collected responses into clean, structured, and analyzable information. It covers everything from removing duplicate entries to standardizing formats and flagging inconsistent answers. It sounds routine. It is anything but.
When data processing is weak, the consequences ripple outward fast. Poor data cleaning leads to a 23% drop in model accuracy and accounts for 40% of project errors. That means your segmentation models, your pricing research, your customer satisfaction scores — all of it becomes less trustworthy. Decision-makers act on flawed signals. Strategies get built on shaky ground.
“Data quality is not a data team problem. It is an organizational risk problem.”
Good data processing changes that picture entirely. Here is what it delivers:
- Sharper clarity in findings, so insights are actionable rather than ambiguous
- Stronger decision confidence for leadership and stakeholders
- Reduced risk of costly strategic missteps
- Client trust built on repeatable, transparent methodology
- Regulatory alignment with standards like ESOMAR guidelines
We know from experience that the importance of secure data handling goes hand in hand with processing quality. You cannot separate the two. And if you want a broader view of where processing fits, the market research process overview shows exactly how each phase connects.
The essential steps of data processing
There is a reason experienced researchers follow a structured sequence. Skipping steps or reordering them creates compounding problems. The six essential phases are: define the problem, collect data, clean, analyze, validate, and interpret. Cleaning alone comprises 60 to 80% of total project time.
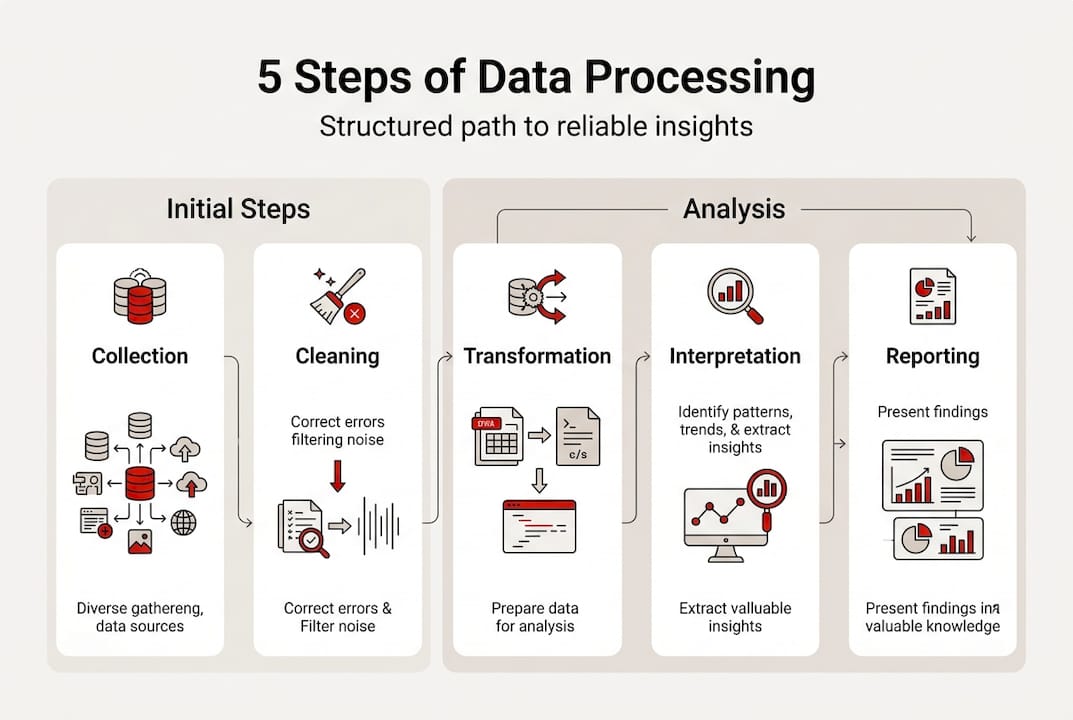
Here is how each phase breaks down in practice:
| Phase | What happens | Typical time share | Common tools |
|---|---|---|---|
| Define | Set objectives, variables, success criteria | 5% | Brief documents, logic maps |
| Collect | Gather responses via surveys, interviews, panels | 10% | Survey platforms, CRMs |
| Clean | Remove errors, duplicates, outliers, blanks | 60-80% | R, Python, Excel |
| Analyze | Run statistical models, cross-tabs, regressions | 10% | SPSS, R, Python |
| Validate | Cross-check findings against benchmarks | 5% | Tableau, manual review |
| Interpret | Translate numbers into business language | 5% | Reporting tools, decks |
For a real-life scenario, here is how a corporate brand tracker would move through these steps:
- Define the research objective: measure brand awareness shifts across three customer segments.
- Collect responses via an online panel of 1,200 respondents.
- Clean the dataset: remove speeders, flag trap question failures, handle missing values.
- Analyze using cross-tabulations and trend comparisons against prior waves.
- Validate findings by triangulating with social listening data.
- Interpret results into a clear narrative for the marketing leadership team.
For a deeper look at how analysis fits into this sequence, the data analysis process breakdown is worth bookmarking.
Pro Tip: Invest the most resources in the cleaning phase. Errors caught early cost almost nothing to fix. Errors caught after analysis can invalidate entire project waves.

Core methodologies and advanced techniques
Knowing the steps is one thing. Knowing the methods inside each step is where real precision lives. Four core methodologies drive effective data processing: validation, normalization, aggregation, and integration.
Data cleaning steps include validation through cross-verification, transformation via normalization and aggregation, and integration of multiple data sources. Each serves a specific purpose.
Here is a quick reference for the most common data issues and how to handle them:
| Issue | Method | Why it works |
|---|---|---|
| Duplicate records | Exact and fuzzy matching | Removes redundancy without losing valid entries |
| Missing values | KNN imputation, mean substitution | Preserves dataset size and statistical power |
| Outliers | Z-score analysis, winsorizing | Reduces distortion while retaining real variation |
| Inconsistent formats | Min-max normalization | Standardizes scale across variables |
| Null placeholders | Rule-based replacement | Prevents false zeros from skewing averages |
Modern tools make this faster and more reliable. R and Python handle large-scale cleaning with reproducible scripts. Tableau surfaces anomalies visually. Real-time monitoring flags issues as data comes in, rather than after the fact.
For teams exploring AI-driven data cleaning, the efficiency gains are real, especially on high-volume panel projects where manual review alone cannot keep pace.
Pro Tip: Track your missing data rate throughout cleaning. If it stays below 5%, your dataset is in solid shape. If it climbs above that, investigate the source before moving to analysis.
Expert pitfalls and nuances: Handling edge cases
Here is something that surprises a lot of teams: 20 to 50% of online panel survey responses may be fraudulent or inattentive. That is not a small rounding error. That is potentially half your dataset.
“Robust quality checks are not optional. On panel data, they are the difference between insight and noise.”
Edge cases are where projects quietly fall apart. The most common culprits include:
- Speeders: Respondents who complete a 15-minute survey in under 3 minutes
- Straight-liners: People who select the same answer for every scale question
- Trap question failures: Respondents who miss deliberate attention checks
- Inconsistent answers: Contradictory responses within the same survey (e.g., age vs. graduation year)
- Unicode and HTML artifacts: Encoding errors that corrupt open-ended text fields
- Placeholder values: Entries like “999” or “N/A” that look like real data
The best defense is a hybrid workflow. Automated checks catch volume issues fast. Manual review catches the subtle ones that algorithms miss. Neither alone is sufficient.
For a fuller picture of where research projects go sideways, the resource on pitfalls in research data processing covers the most common failure points we see across B2B, B2C, and healthcare studies.
Adaptive strategies and approaches in data processing
Not every project calls for the same approach. A 10,000-record online panel needs different handling than a 40-person qualitative study. Choosing the right strategy matters as much as executing it well.
Here is a comparison of the main approaches:
| Approach | Best for | Trade-off |
|---|---|---|
| Stepwise (structured) | Large-scale quantitative panels | Less flexible mid-project |
| Iterative | Exploratory or qualitative research | Slower, requires more oversight |
| Automated cleaning | High-volume, time-sensitive projects | May miss nuanced errors |
| Manual review | Small samples, sensitive data | Labor-intensive, not scalable |
| Listwise deletion | Simple datasets with low missingness | Can bias results if overused |
| KNN imputation | Complex datasets with scattered gaps | 15% more accurate than deletion |
| Winsorizing | Datasets with extreme outliers | Preserves 88% of utility vs. removal |
Listwise deletion is simple and fast, but it can introduce bias when missing data is not random. Winsorizing and KNN imputation preserve far more of your dataset’s analytical value. For most corporate and nonprofit research projects, imputation is the smarter default.
If you are evaluating how different agencies approach these decisions, the guide on full-service agency strategies is a useful benchmark.
Applying data processing best practices: A step-by-step guide
Ready to put this into practice? Here is a streamlined workflow that works for both corporate teams and nonprofit organizations, regardless of project size.
- Assess your data landscape. Before touching anything, document what you have: volume, format, source, and known quality issues.
- Select your tools. For scalable projects, R, Python, and Tableau offer the best combination of power and flexibility.
- Set up real-time monitoring. Configure alerts for anomalies during data collection, not after. Catching errors early prevents downstream propagation.
- Execute cleaning systematically. Work through duplicates, missing values, outliers, and format inconsistencies in a defined order. Do not skip steps.
- Validate against external benchmarks. Cross-check key findings with industry data, prior waves, or secondary sources to confirm plausibility.
- Triangulate your findings. Where conflicts exist between data sources, resolve them through structured triangulation before drawing conclusions.
- Document everything. Record your workflow, every decision made, and any deviations from the original plan.
Documentation is the step most teams skip. It is also the step that makes your research repeatable, auditable, and trustworthy to clients and stakeholders.
For teams looking to connect these practices to a broader research strategy, custom research solutions can help you map the right approach to your specific objectives.
Pro Tip: Treat your data processing documentation like a lab notebook. If someone else picked it up tomorrow, they should be able to reproduce your exact workflow without asking a single question.
Get expert help with data processing in your market research
Data processing done right takes expertise, the right tools, and a methodology that fits your project, not a generic template. That is exactly what we do at Veridata Insights. We work with corporate teams and nonprofits across B2B, B2C, and healthcare research, handling everything from questionnaire design and data collection to full processing, coding, and analytics. No project minimums. Seven days a week. Whether you need end-to-end support or just a second set of expert eyes on your cleaning workflow, we are here for it. Speak with Veridata experts today and let us help you turn raw data into insights you can actually trust.
Frequently asked questions
What is the most common data processing mistake in market research?
The most common mistake is rushing through data cleaning. Insufficient cleaning causes up to 40% of project errors and reduces model accuracy by as much as 23%, which means your findings are already compromised before analysis even begins.
How do you handle fraudulent or inattentive survey responses?
Build trap questions into your survey design, run speed checks on completion times, and apply conservative cleaning thresholds. 20 to 50% of panel responses can be low quality, so robust screening is non-negotiable, not optional.
Which tools are best for data processing in nonprofits and corporates?
R, Python, and Tableau are the most widely used and reliable options. These scalable tools support automated cleaning workflows and real-time monitoring, making them practical for both large corporate panels and leaner nonprofit studies.
Is deletion or imputation better for missing data?
Imputation almost always wins. Winsorizing preserves 88% of data utility and KNN imputation is 15% more accurate than listwise deletion, which can introduce bias when missing data is not randomly distributed.
What benchmarks indicate reliable data processing?
Aim for a missing data rate below 5% after cleaning and ensure your process aligns with ESOMAR guidelines. A sub-5% missing rate is the clearest signal that your dataset is ready for analysis.
Recommended
- Data analysis step by step for market researchers in 2026 – Veridata Insights
- The Market Research Process Simplified for Consulting Teams – Veridata Insights
- Custom Market Research Solutions: Turning Data Into Strategy with Veridata Insights – Veridata Insights
- How Veridata Insights Ensures Your Market Research Project Is A Success – Veridata Insights
- Maximise fulfilment efficiency with data strategies in 2026 | ParcelPlanet


