TURF analysis – short for Total Unduplicated Reach and Frequency – finds the combination of products, messages, or features that reaches the largest number of unique customers from a fixed portfolio size. Originally developed for media planning, it now drives product-assortment decisions across consumer goods, healthcare, and B2B markets. The core output is simple: for every possible portfolio size, TURF tells you which set of items maximizes unduplicated reach and how often the average reached customer finds something acceptable.
Run TURF when you have a limited number of slots and need to know which items to fill them with. Skip it when your question is about pricing trade-offs, attribute importance, or complex feature bundles where conjoint analysis is the right tool.
TURF fits these decisions well:
- Which 4 SKUs should we launch when shelf space allows only 4?
- Which 3 messages cover the broadest audience for a campaign?
- Which menu items maximize the number of diners who find at least one option acceptable?
- Which product variants should we stock given a constrained budget?
Key Takeaways
TURF analysis maximizes unduplicated customer reach for a fixed portfolio size, and the winning combination is rarely the set of individually most popular items.
| Point | Details |
|---|---|
| Use TURF for limited slots | Run TURF when shelf space, budget, or launch capacity constrains how many items you can offer. |
| Individual-level data is required | TURF needs a binary acceptance matrix per respondent; aggregated percentages produce incorrect reach estimates. |
| Check thresholds and run sensitivity | Test two or three acceptance thresholds and compare the portfolios; report both scenarios if the results shift. |
| Read the incremental reach curve | Stop adding SKUs when marginal reach gains drop below your operational cost threshold. |
| Veridata Insights | Veridata Insights delivers end-to-end TURF projects, from survey design and recruitment through modeling and client-ready reporting. |
Table of Contents
- When does TURF analysis deliver the most value?
- What reach, frequency, and overlap actually mean
- What data does TURF need, and how should you design the survey?
- How to run TURF step by step
- How TURF is actually computed: exhaustive search vs. greedy heuristics
- Worked examples: calculating unduplicated reach yourself
- How to turn TURF outputs into actual product decisions
- Common TURF pitfalls and how to avoid them
- What to look for when choosing TURF software or a vendor
- How Veridata Insights applies TURF in practice
- Veridata Insights makes TURF work for your portfolio decisions
- Sources
When does TURF analysis deliver the most value?
TURF earns its place when the business question is explicitly about coverage: how many distinct people can we reach with a fixed set of options? It answers questions like “which 5 flavors maximize unique buyers?” or “which combination of benefit messages covers the most survey respondents?” according to SurveyMonkey’s practical TURF guide.
It is less useful when the question involves price sensitivity, willingness-to-pay trade-offs, or attribute-level preferences. For those, MaxDiff or conjoint analysis is a better fit. A quick comparison: MaxDiff ranks items by individual preference intensity; conjoint measures trade-offs between attributes at different price points; TURF optimizes portfolio coverage across a population. Use MaxDiff to shortlist candidates, then TURF to pick the final set.
What reach, frequency, and overlap actually mean
Three numbers drive every TURF output. Getting them straight makes the rest of the analysis readable.
- Reach (unduplicated reach): The percentage of respondents who find at least one item in a portfolio acceptable. If 60 out of 100 respondents accept at least one item in your 3-SKU set, reach is 60%.
- Frequency: The average number of acceptable items per reached respondent within that portfolio. A frequency of 1.8 means the average reached customer finds nearly 2 items acceptable.
- Overlap: The share of respondents who find more than one item acceptable. High overlap means two items are serving the same people, adding frequency but not reach.
Overlap is why the most popular individual item rarely anchors the best portfolio. Adding a second item that appeals to the same fans as item one increases frequency but barely moves reach. A less popular, niche item that attracts a distinct segment can push reach higher than a second blockbuster would. Kellogg Insight’s research on preference heterogeneity explains the behavioral mechanism: consumers differ enough in their preferences that a diverse portfolio consistently outperforms a concentrated one on coverage.
Visualize overlap with a Venn diagram. Draw a circle for each item; the overlapping area represents respondents who accept both. The union of all circles is your unduplicated reach.
What data does TURF need, and how should you design the survey?
Displayr’s TURF documentation is direct: TURF requires individual-level binary acceptance data. Each respondent gets a 1 (acceptable) or 0 (not acceptable) for every item tested. That binary matrix is the engine input.
Acceptable input types:
- Multi-select acceptance questions (“Select all products you would consider buying”)
- Rating scales converted to binary (e.g., top-2-box = 1, all others = 0)
- MaxDiff utilities converted to binary using a threshold score
- Purchase history coded as accept/reject per category
A clean survey question looks like: “Which of the following flavors would you consider purchasing? Select all that apply.” For rating scales, ask respondents to rate each item on a 5-point scale, then convert ratings of 4 or 5 to a 1 and everything else to a 0.
Sample size matters. With fewer than 200 respondents, small percentage differences in reach are statistically unreliable. For segment-level TURF, each segment needs its own adequate base. Missing data is a real hazard: a respondent who skips half the items creates a distorted acceptance matrix. Either impute conservatively (treat missing as 0) or exclude incomplete rows and document the decision.
Pro Tip: Run your TURF at two or three acceptance thresholds (e.g., top-2-box and top-box only) and compare the recommended portfolios. If the winning set changes dramatically between thresholds, your results are threshold-sensitive and you should report both scenarios to stakeholders rather than presenting a single answer as definitive.
For B2B studies, survey design principles around question wording and respondent fatigue apply directly: keep the item list manageable (under 20 items per battery) and randomize item order to prevent position bias.
How to run TURF step by step
- Define objectives and portfolio-size range. Decide the minimum and maximum number of items you want to evaluate (e.g., portfolios of 2 through 6 SKUs). Confirm the business constraint driving that range.
- Prepare the acceptance matrix. Export individual-level data. Convert all inputs to binary. Flag and handle missing data. Randomize item order if not already done in the survey.
- Select an algorithm. For item sets under roughly 20 candidates, exhaustive search is feasible. For larger sets, a greedy heuristic is standard. (See the algorithm section below.)
- Run portfolios across all target sizes. Generate the reach and frequency for every portfolio size in your defined range.
- Inspect the incremental reach curve. Plot reach against portfolio size. The curve rises steeply at first, then flattens. The inflection point is your natural stopping rule.
- Validate with holdout and segment checks. Hold out 20% of respondents, run TURF on the remaining 80%, and confirm the winning portfolio performs similarly on the holdout. Run TURF separately by key segments and compare recommended sets.
- Document deliverables. At minimum: the binary acceptance matrix, a reach-by-size table, an incremental reach curve, and a recommended portfolio with notes on operational constraints.
How TURF is actually computed: exhaustive search vs. greedy heuristics
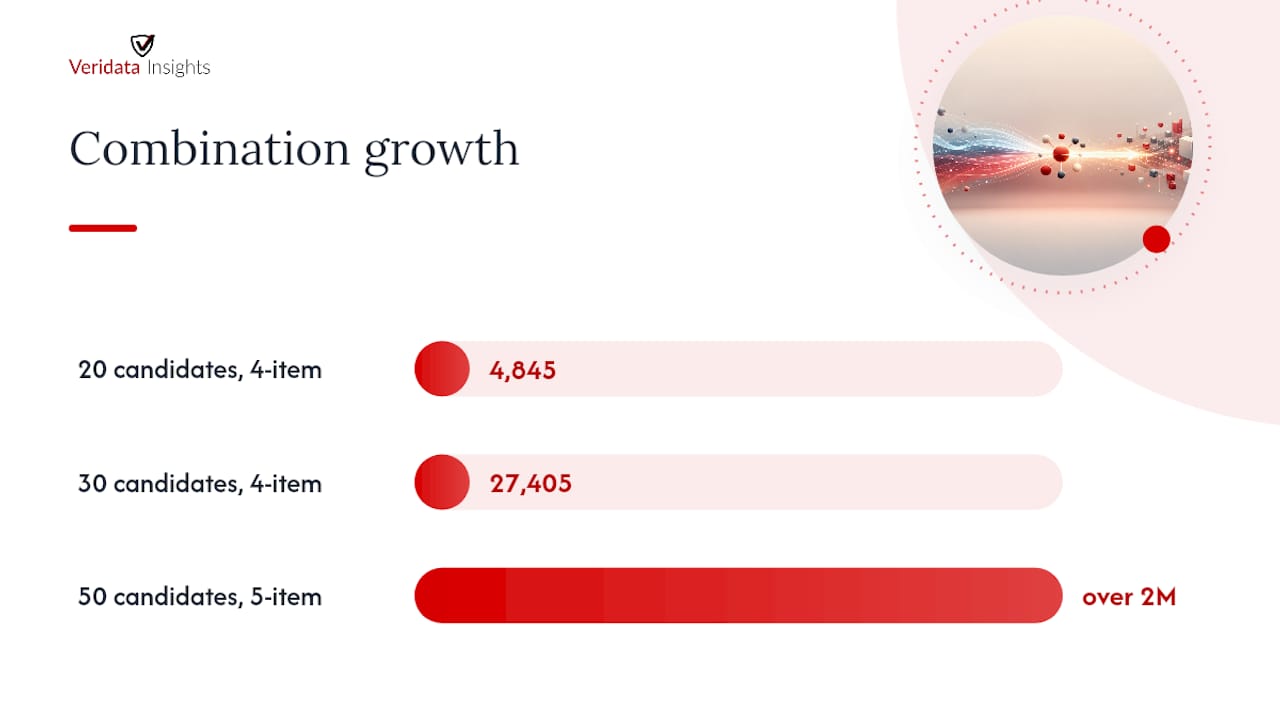
TURF evaluates combinations of items, and the number of combinations grows fast. Testing all possible 4-item portfolios from 20 candidates means evaluating 4,845 combinations. From 30 candidates, that number jumps to 27,405. From 50 candidates at portfolio size 5, you are looking at over 2 million combinations. The technical literature on combinatorial selection confirms that greedy approximations provide a reliable practical lower bound when the full combination space becomes computationally expensive.
The greedy heuristic works iteratively: pick the single item with the highest reach, then add the item that produces the largest incremental reach gain, and repeat until the portfolio is full. It is fast and almost always finds the optimal or near-optimal set for typical market-research item counts.
| Criterion | Exhaustive search | Greedy heuristic |
|---|---|---|
| Reach optimality | Guaranteed optimal | Near-optimal in practice |
| Compute time | Grows exponentially with item count | Fast even for large item sets |
| Best for | Under ~20 candidate items | 20+ candidate items |
| Risk | Impractical at scale | May miss optimal set in rare edge cases |
For most product-portfolio studies with 10–25 items, the greedy heuristic is sufficient. If your item set is small enough for exhaustive search, use it; the guarantee of optimality is worth the extra compute time.
Worked examples: calculating unduplicated reach yourself
These synthetic examples show the mechanics. Reproduce them in a spreadsheet to validate any software output.
2-item example. Five respondents, two items (A and B):
| Respondent | Item A | Item B |
|---|---|---|
| R1 | 1 | 0 |
| R2 | 0 | 1 |
| R3 | 1 | 1 |
| R4 | 0 | 0 |
| R5 | 1 | 0 |
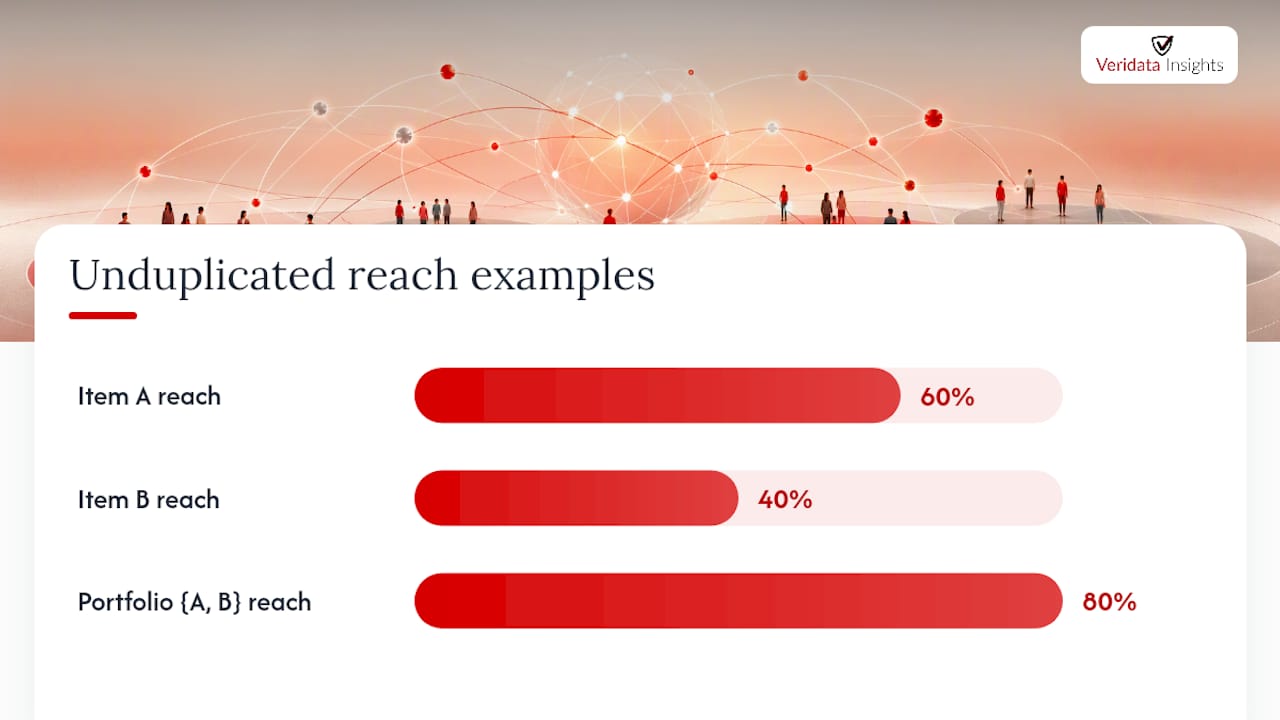
Reach of A alone: R1, R3, R5 = 3/5. Reach of B alone: R2, R3 = 2/5. Unduplicated reach of {A, B}: R1, R2, R3, R5 = 4/5. Frequency for the {A, B} portfolio: R3 accepts both, so total acceptances = 5 across 4 reached respondents.
3-item jam-stand example. A vendor sells jam at a farmers’ market and can display only 3 jars. Five flavors are tested (Strawberry, Blueberry, Peach, Raspberry, Apricot) with 10 respondents each rating acceptable or not:
| Portfolio size | Best combination | Reach |
|---|---|---|
| 1 item | Strawberry | a majority |
| 2 items | Strawberry + Blueberry | notably more |
| 3 items | Strawberry + Blueberry + Peach | even more |
| 4 items | + Raspberry | increased coverage |
| 5 items | + Apricot | higher coverage |
The incremental reach gains diminish as items are added, showing diminishing returns. The curve flattens sharply after 3 items. For a vendor with 3 display slots, {Strawberry, Blueberry, Peach} is the defensible choice. Adding Raspberry gains only 5 more points of reach while adding operational complexity. That is the diminishing-returns logic Quali-Fi documents in their worked portfolio-size tables: the optimal set at each size is not simply the top-ranked individual items stacked together.
How to turn TURF outputs into actual product decisions
Reach numbers alone do not launch a product. Before committing to the mathematically winning portfolio, run it through a practical filter:
- Profitability check: Does each item in the winning set meet margin requirements? A high-reach niche item with poor unit economics may not survive the filter.
- Operational constraints: Can supply chain support the full set? Minimum order quantities, shelf-life, and production complexity all affect feasibility.
- Marginal-gain threshold: Read the incremental reach column. If adding a fourth SKU gains fewer than 3–4 percentage points of reach, the operational cost of that SKU likely outweighs the coverage benefit.
- Segment-level comparison: Run TURF separately by region, age group, or purchase occasion. When the optimal set differs meaningfully by segment, consider whether a single national portfolio or multiple tailored mixes better fits your go-to-market model. Understanding how consumer preferences shift by segment is often the difference between a portfolio that tests well and one that sells well.
Quantilope’s platform documentation notes that locking “must-have” items before running the remaining variable slots is a standard practitioner technique when brand or contractual constraints require certain SKUs to be included regardless of their individual reach contribution. This constrained TURF approach keeps the math honest while reflecting real-world business rules.
Common TURF pitfalls and how to avoid them
Even well-designed studies can produce misleading TURF results. Watch for these:
- Using aggregated data instead of individual-level responses. TURF requires row-level binary data. Running it on summary percentages produces incorrect reach estimates.
- A poorly chosen acceptance threshold. Setting the bar too high (top-box only on a 10-point scale) can make every item look niche. Too low (any positive rating) inflates reach artificially.
- Ignoring missing data. Respondents who skip items create gaps in the acceptance matrix. Treat missing as 0 or exclude the row, but document the choice and test sensitivity.
- Assuming customers buy only one item. TURF measures reach (at least one acceptable item), not purchase exclusivity. Frequency tells you how many items the average reached customer finds acceptable, which is a useful signal for upsell potential.
- Small sample sizes producing unstable results. A 2-percentage-point difference in reach between two portfolios is not meaningful at n=150. Bootstrap the sample to generate confidence intervals and report ranges, not point estimates.
- Skipping operational validation. The mathematically optimal portfolio sometimes includes a low-volume niche item that cannot be produced at minimum viable quantities. Always cross-check winners against supply and finance before presenting recommendations.
For a statistically sound study, treat any reach difference under 3–5 percentage points between competing portfolios as a practical tie unless your sample is large enough to support that precision.
What to look for when choosing TURF software or a vendor
You do not need a dedicated platform to run TURF on small item sets. A spreadsheet with a combinatorial loop or an R script handles studies with fewer than 15 items cleanly. For larger studies or recurring work, a commercial research platform automates the combinatorial engine, produces visual reach curves, and supports segment-level comparisons without manual coding.
Feature checklist for any tool or vendor:
- Automated combinatorial engine (exhaustive or greedy, clearly documented)
- Binary, MaxDiff-converted, and rating-scale input support
- Reach and incremental reach visualization (curve and table)
- Segment-level TURF with side-by-side comparison
- Ability to lock must-have items before running variable slots
- Exportable tables and charts for client reporting
- Bootstrapping or confidence-interval support for small samples
Questions to ask any vendor before buying:
- Which algorithm do you use, and can you switch between exhaustive and greedy?
- How does the platform handle missing data in the acceptance matrix?
- What sample-size guidance do you provide for reliable reach estimates?
- What does a standard deliverable package look like?
For complex multi-country studies, full-service vendor support beats a self-serve platform. A vendor that handles questionnaire design, recruitment, data processing, and TURF modeling in one engagement removes the coordination risk that comes with stitching together multiple tools.
How Veridata Insights applies TURF in practice
At Veridata Insights, TURF projects follow a structured workflow that maps directly to the steps above, with one team handling every stage.
Workflow responsibilities:
- Questionnaire design and acceptance-question wording, including threshold sensitivity planning
- Recruitment across B2B, B2C, healthcare, and hard-to-reach audiences with no project minimums
- Data processing, binary conversion, and missing-data documentation
- TURF modeling across all target portfolio sizes, with greedy and exhaustive runs where feasible
- Validation via holdout samples and segment-level comparisons
- Client-ready reporting with reach-by-size tables, incremental reach curves, and recommended portfolios annotated with operational notes
Standard deliverables clients receive: a cleaned binary acceptance matrix, reach and frequency by portfolio size, an incremental reach curve with annotated inflection point, the recommended portfolio set with marginal-gain rationale, and a segment comparison when the study design supports it. Our end-to-end research capabilities cover every step from study design through final visualization.
In one anonymized consumer-packaged-goods engagement, a client needed to decide which 4 of 12 tested flavors to launch nationally. Individual popularity rankings pointed to the top 4 by acceptance rate. TURF analysis identified a different 4-item set that reached 11 percentage points more unique buyers, because the fifth-ranked flavor individually served a distinct demographic segment with almost no overlap with the top 3. The client launched the TURF-recommended set. The niche flavor became a top-3 seller within two quarters, precisely because it reached buyers the other three flavors did not.
Pro Tip: Always validate a niche “TURF winner” against operational minimums before presenting it as a recommendation. A flavor that expands reach by 8 points is compelling on paper, but if it cannot be produced at a viable minimum run quantity, it belongs in a future-pipeline conversation, not the launch plan.
A methodology review or consultation with Veridata Insights takes about 30 minutes and can confirm whether your study design will produce reliable TURF inputs. Reach out here to start that conversation.
Veridata Insights makes TURF work for your portfolio decisions
TURF analysis is only as good as the data behind it. That is where most teams run into trouble: the survey design is off, the acceptance thresholds are arbitrary, or the analysis stops at the reach table without connecting to supply or finance. Veridata Insights handles the full chain, from question design and recruitment through TURF modeling and client-ready reporting, with no project minimums and availability seven days a week.
Whether you need a quick pilot study to test 8 flavors or a multi-country assortment study across 30 SKUs, the team at Veridata Insights brings the methodology expertise and recruitment reach to make the results defensible. Analytics-driven portfolio decisions consistently outperform gut-feel assortment choices, and TURF is one of the clearest paths to that discipline. Contact Veridata Insights to discuss your next portfolio study.
Sources
Recommended
- Understanding Total Addressable Market (TAM) Analysis – Veridata Insights
- Why You Should Run Competitive Analysis – Veridata Insights
- Market Benchmarking: Gaining an Edge in Competitive Landscapes – Veridata Insights
- How Do I Conduct Effective Market Analysis to Support a New Product Launch Strategy? – Veridata Insights