
TL;DR:
- Political polling relies on careful surveys and representative sampling to accurately measure public opinion. High response rates are essential, but modern challenges mean correct weighting and question design are equally crucial. Ethical transparency and rigorous methodology prevent misleading results that could influence elections and public discourse.
Political polling is the scientific measurement of public opinion through carefully designed surveys, representative sampling, and rigorous data analysis. Done well, it produces accurate, decision-ready insights for campaign strategists, journalists, and policy analysts. Done poorly, it misleads entire campaigns. This guide walks you through every step of how to conduct political polling, from building your sampling frame to interpreting results, with the methodology depth that professionals actually need.
How to conduct political polling: the foundational steps
Political opinion polling, the industry’s standard term, follows a structured sequence. Each step depends on the one before it. Skipping or rushing any stage compounds error downstream.

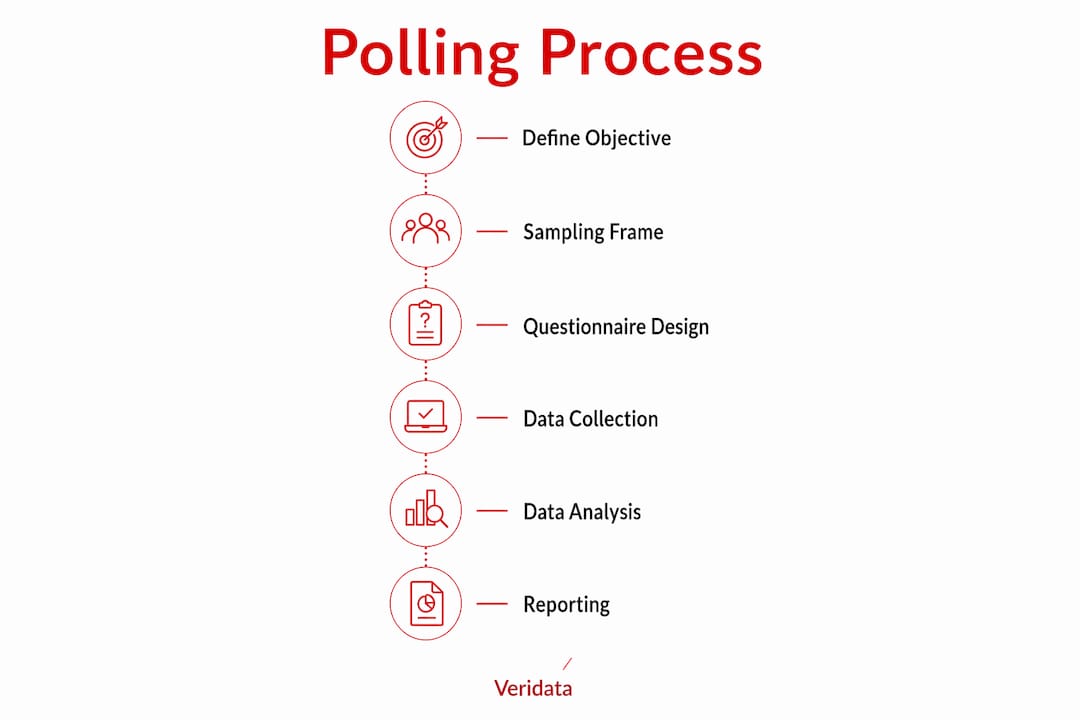
The process breaks into five core stages: define your research objective, build your sampling frame, design your questionnaire, collect data, and analyze results. Veridatainsights works across all five, but you can execute each independently if you have the right tools and methodology in place.
Define your research objective first. Are you measuring candidate favorability, issue salience, or likely voter turnout? The answer shapes every subsequent decision, from sample size to question wording. A poll designed to measure name recognition requires different question architecture than one measuring vote intent.
What are the essential tools and prerequisites for political polling?
The right tools determine whether your data is usable or garbage. Political survey methodology requires three categories of infrastructure: a sampling frame, a data collection system, and a questionnaire platform.
Sampling frames define who is eligible to participate. Voter registration files from state election boards are the gold standard for likely voter polls. For broader public opinion work, the U.S. Census Bureau’s American Community Survey provides demographic benchmarks for weighting.
Data collection systems include:
- Random Digit Dialing (RDD): reaches both listed and unlisted phone numbers; best for general population samples
- Computer-Assisted Telephone Interviewing (CATI) software: automates call routing, skip logic, and real-time data capture
- Online panels: faster and cheaper than phone, but require careful weighting to correct for self-selection
- Text-to-web surveys: growing in use, particularly for younger voter segments
Questionnaire platforms like Qualtrics and SurveyMonkey handle programming, skip logic, and data export. For large-scale election polling, CATI systems remain the professional standard because they allow live interviewers to probe ambiguous answers.
| Method | Strengths | Weaknesses |
|---|---|---|
| RDD phone | High coverage, random selection | Declining response rates |
| Online panel | Fast, cost-effective | Self-selection bias |
| CATI | Interviewer probing, quality control | Expensive, slow |
| Text-to-web | Mobile-friendly, younger reach | Low completion rates |
Access to voter file data, demographic benchmarks, and a clear weighting plan are prerequisites before you collect a single response. Without them, you are collecting opinions, not polling data.
How to design an unbiased and effective political survey questionnaire
Question design is where most polls fail. Questionnaire neutrality requires that every question present both sides of an issue without favoring either. A question like “Do you support the governor’s bold new tax plan?” is leading. “Do you support or oppose the governor’s proposed tax increase?” is neutral.
Pew Research Center confirms that question order affects responses. The standard practice is to move from general to specific. Ask about the economy broadly before asking about a specific candidate’s economic policy. Reversing that order primes respondents and distorts results.
Questionnaire design best practices:
- Use simple, single-concept questions. Never ask two things in one sentence.
- Offer balanced response scales. A five-point scale from “strongly support” to “strongly oppose” gives respondents room to express nuance.
- Randomize answer order for candidate name questions to eliminate primacy bias.
- Include a “don’t know” or “no opinion” option. Forcing a choice inflates false certainty.
- Pilot test every questionnaire with 20–50 respondents before full launch. Cognitive testing reveals confusing wording that desk review misses.
- Keep the survey under 15 minutes. Completion rates drop sharply beyond that threshold.
Pro Tip: Run your draft questionnaire through questionnaire design review with a methodologist before programming. One ambiguous question can invalidate an entire data set.
Pilot testing is non-negotiable for professional-grade work. It catches double-barreled questions, confusing terminology, and response scale problems before they contaminate your full sample.
Which sampling methods are most effective for political polling?
Sampling is the engine of polling accuracy. A well-constructed random sample of 1,000 people represents a large population with a margin of error of ±3.1 percentage points at 95% confidence. That number is the industry benchmark for statewide and national polls.
Three sampling strategies dominate professional political polling:
Random sampling gives every member of the target population an equal chance of selection. It is the theoretical ideal but increasingly hard to execute as response rates fall.
Stratified sampling divides the population into subgroups (age, race, gender, geography) and samples each proportionally. It reduces variance and improves representation of smaller demographic groups.
Weighting adjustments correct for the gap between who responded and who the population actually looks like. Raking, propensity score weighting, and modeling are the three main calibration approaches. Variable selection in weighting models often has greater impact on accuracy than the weighting method itself. Choosing variables that predict both sample selection and political opinion is the critical decision.
| Sample size | Margin of error (95% confidence) |
|---|---|
| 400 | ±4.9 points |
| 600 | ±4.0 points |
| 1,000 | ±3.1 points |
| 1,500 | ±2.5 points |
| 2,400 | ±2.0 points |
Likely voter screens add another layer of complexity. The Gallup likely voter screen uses seven questions to classify respondents as likely voters, including past voting behavior and knowledge of their polling place. The choice of screen can shift final poll results by 2–4 percentage points. That swing can flip a competitive race in your data.
Pro Tip: Use a multifaceted likely voter screen rather than a single self-reported intent question. Asking “Do you plan to vote?” alone produces inflated turnout estimates. Behavioral history questions are far more predictive.
Non-response bias is the biggest threat to modern polling. Response rates for live-call phone surveys have fallen from 35% in 1990 to 2–6% in 2023. Pollsters now contact 20–50 people for each completed interview. That ratio means the people who do respond are systematically different from those who do not, and weighting must correct for that gap aggressively.
What are the best practices for analyzing polling data?
Data analysis is where raw responses become usable intelligence. The first step is data cleaning: removing incomplete responses, flagging speeders (respondents who completed the survey too fast to have read the questions), and checking for straight-lining (selecting the same answer for every question).
Statistical weighting corrects non-representative samples. Calibration weighting compares your sample’s demographic profile to known population benchmarks and adjusts each respondent’s contribution to the final result accordingly. The goal is a weighted sample that mirrors the actual electorate.
Margin of error interpretation is widely misunderstood. The margin applies independently to each candidate’s estimate. The combined margin for the difference between two candidates is approximately ±4.4 points when each individual margin is ±3 points. A poll showing Candidate A at 48% and Candidate B at 45% is statistically tied, not a lead. Reporting it as a lead is a common and consequential error.
Analysis best practices:
- Cross-tabulate results by key subgroups: age, party ID, gender, and geography. Topline numbers hide the story.
- Check for herding bias. If your results cluster suspiciously close to other published polls, your weighting may be anchored to prior data rather than your actual sample.
- Report the full methodology, including sample size, field dates, weighting variables, and margin of error. Transparency is the standard for credible polling.
- Use data visualization tools to communicate findings clearly. A well-designed chart communicates a trend faster than a table of numbers.
For a step-by-step walkthrough of the full analysis process, the data analysis guide from Veridata Insights covers current methodologies in detail.
How to avoid common mistakes in political polling
The most damaging polling errors are structural, not statistical. They happen before data collection begins.
Low response rates are the defining challenge of modern polling. When only 2–6% of contacted people respond, the sample is self-selected by definition. Weighting helps, but it cannot fully correct for a fundamentally unrepresentative pool of respondents.
Common pitfalls to avoid:
- Launching without a pilot test. Untested questions produce unreliable data.
- Using convenience samples. Online opt-in panels without weighting are not representative of the electorate.
- Overrelying on early field data. Public opinion shifts during a campaign, and a poll conducted six weeks before election day is not a prediction.
- Ignoring non-response patterns. If certain demographic groups systematically refuse to participate, your results skew toward those who do.
- Publishing without full methodology disclosure. Credible polls include field dates, sample size, weighting approach, and margin of error.
Pro Tip: Follow the ethical research standards established for professional polling. Transparency about methodology is not optional. It is the difference between a poll that informs and one that misleads.
Public opinion research carries real consequences. A misleading poll can shift media coverage, suppress voter turnout, and distort campaign resource allocation. The ethical obligation to get it right is as important as the methodological one.
Key Takeaways
Effective political polling requires unbiased question design, representative sampling, and rigorous data analysis executed in sequence, with no step skipped.
| Point | Details |
|---|---|
| Define objectives first | Your research question determines sample design, question wording, and analysis approach. |
| Sample size drives accuracy | A sample of 1,000 yields a ±3.1-point margin of error at 95% confidence. |
| Question neutrality is non-negotiable | Leading questions invalidate results; always present both sides of an issue. |
| Weighting corrects bias | Variable selection in weighting models matters more than the weighting method itself. |
| Margin of error is often misread | The combined margin for a two-candidate difference is wider than each individual margin. |
What I have learned from years of watching polls succeed and fail
Political polling is one of those fields where the gap between “technically correct” and “actually useful” is enormous. I have seen polls with textbook methodology produce results that were practically useless because the research objective was never clearly defined. And I have seen scrappy, lean polls with modest sample sizes outperform expensive national surveys because the question design was sharper and the weighting variables were better chosen.
The single biggest shift I have noticed is how much the response rate collapse has changed the game. When you are contacting 40 people to get one completed interview, you are no longer really doing random sampling in any traditional sense. You are doing aggressive weighting of a self-selected group and hoping your calibration variables are good enough to correct for the bias. That is not a criticism of modern polling. It is just the reality, and the best practitioners are honest about it.
The other thing I keep coming back to is the likely voter screen. Campaigns obsess over topline horse-race numbers, but the likely voter model is where elections are actually won and lost in the data. A two-to-four-point swing from using a weak screen versus a strong one is the difference between a poll that predicts the outcome and one that sends a campaign in the wrong direction.
My honest advice: invest more time in your questionnaire design and your weighting variable selection than in your sample size. A bigger sample with bad questions is still a bad poll.
— Daniel
Veridata Insights can support your political polling work
Veridata Insights brings full-service research capability to political polling projects of any size. From questionnaire design and methodology to data collection, weighting, and reporting, the team handles every stage with no project minimums and availability seven days a week. Whether you need a statewide likely voter poll or a targeted issue survey for a specific district, Veridata Insights builds the methodology around your objective, not a template. If you are ready to run a poll that produces data you can actually trust, reach out to the Veridata Insights team to start the conversation.
FAQ
What is political polling?
Political polling is the scientific measurement of public opinion using structured surveys, representative sampling, and statistical analysis. It produces data used by campaigns, journalists, and policymakers to understand voter preferences and issue positions.
How large does a political poll sample need to be?
A sample of 1,000 respondents produces a margin of error of ±3.1 percentage points at 95% confidence, which is the standard benchmark for statewide and national polls.
What is a likely voter screen?
A likely voter screen is a set of questions used to identify which survey respondents are likely to vote. The Gallup screen uses seven questions, including past voting behavior, and can shift poll results by 2–4 percentage points depending on the screen used.
Why do polls get the margin of error wrong?
The margin of error applies to each candidate’s estimate independently. The combined margin for the difference between two candidates is wider, approximately ±4.4 points when each individual margin is ±3 points, meaning many close races are statistically tied.
How do you reduce bias in political polling?
Bias reduction requires neutral question wording, stratified sampling, calibration weighting using variables predictive of both sample selection and opinion, and full transparency in methodology reporting.


